Differences in health can be seen between many different groups in society – between the best-off financially and the poorest; between those with disability and those without; between men and women.
Such diverse comparison groups expose a range of contributory factors to our health – some are inherited as part of genetic make-up, some are acquired, and some are created by the world that we live in.
The ‘wider determinants of health’ model is a helpful way of understanding how these factors fit together around us to create health and wellbeing (Figure 3.01).
In the 2007-08 Annual Public Health Report, Sara Gibbs (Consultant in Public Health) described the background to our understanding of health inequality[Gibbs S in: Annual Public Health Report 2007-08, pages 71-76. Exeter: Devon County Council/NHS Devon 2008.]. It was in 1860 that differences in mortality were first ascribed to the different environments in which people lived, but it was not until the 1911 census that the Registrar General’s Social Class Classification was included, which asked for details of occupation. This provided
the first opportunity to analyse birth and death statistics in terms of social class. After the 1971 census took place, the analysis showed that a man in social class V (unskilled workers) was 2.5 times more likely to die before the age of 65 than a man in social class I (professional and managerial), and for children in those families, they were twice as likely to die in childhood.
The response by the Labour government at that time was to commission an inquiry into the causes of these differences in health between the social classes. Douglas Black chaired the inquiry which resulted in the publication Inequalities in Health[Black D (Chairman). Inequalities in Health. London: DHSS, 1980.].
A low-key release of the document by the new Conservative government (which came to power in 1979) did not prevent the report receiving huge interest and the report subsequently became a Penguin bestseller. The Black report considered a number of hypotheses as to why health inequalities were increasing rather than decreasing, despite increasing affluence and an expectation that there would be a “trickle-down” of wealth from the more affluent to the less well-off. In the 35 years since the publication of the report, the main explanations for health inequality are material circumstances (such as income, employment, education, good quality housing) and behaviours (such as smoking, alcohol consumption, poor diet, lack of physical activity). Figure 3.02 illustrates Devon’s relative income position and Figure 3.03 shows the striking relationship between income and health, which increases as people get older.
Figure 3.01: The “wider determinants of health” model highlighting where local government can make a difference.
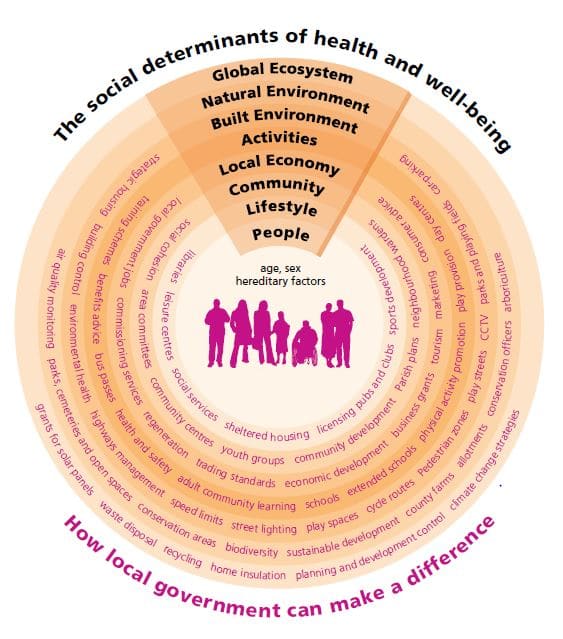
Source: In: Campbell F. The social determinants of health and the role of local goverment. London: LGA/IDeA, 2010.
Figure 3.02: Comparison of full-time annual earnings in Devon with similar local authority areas and England, 2014.
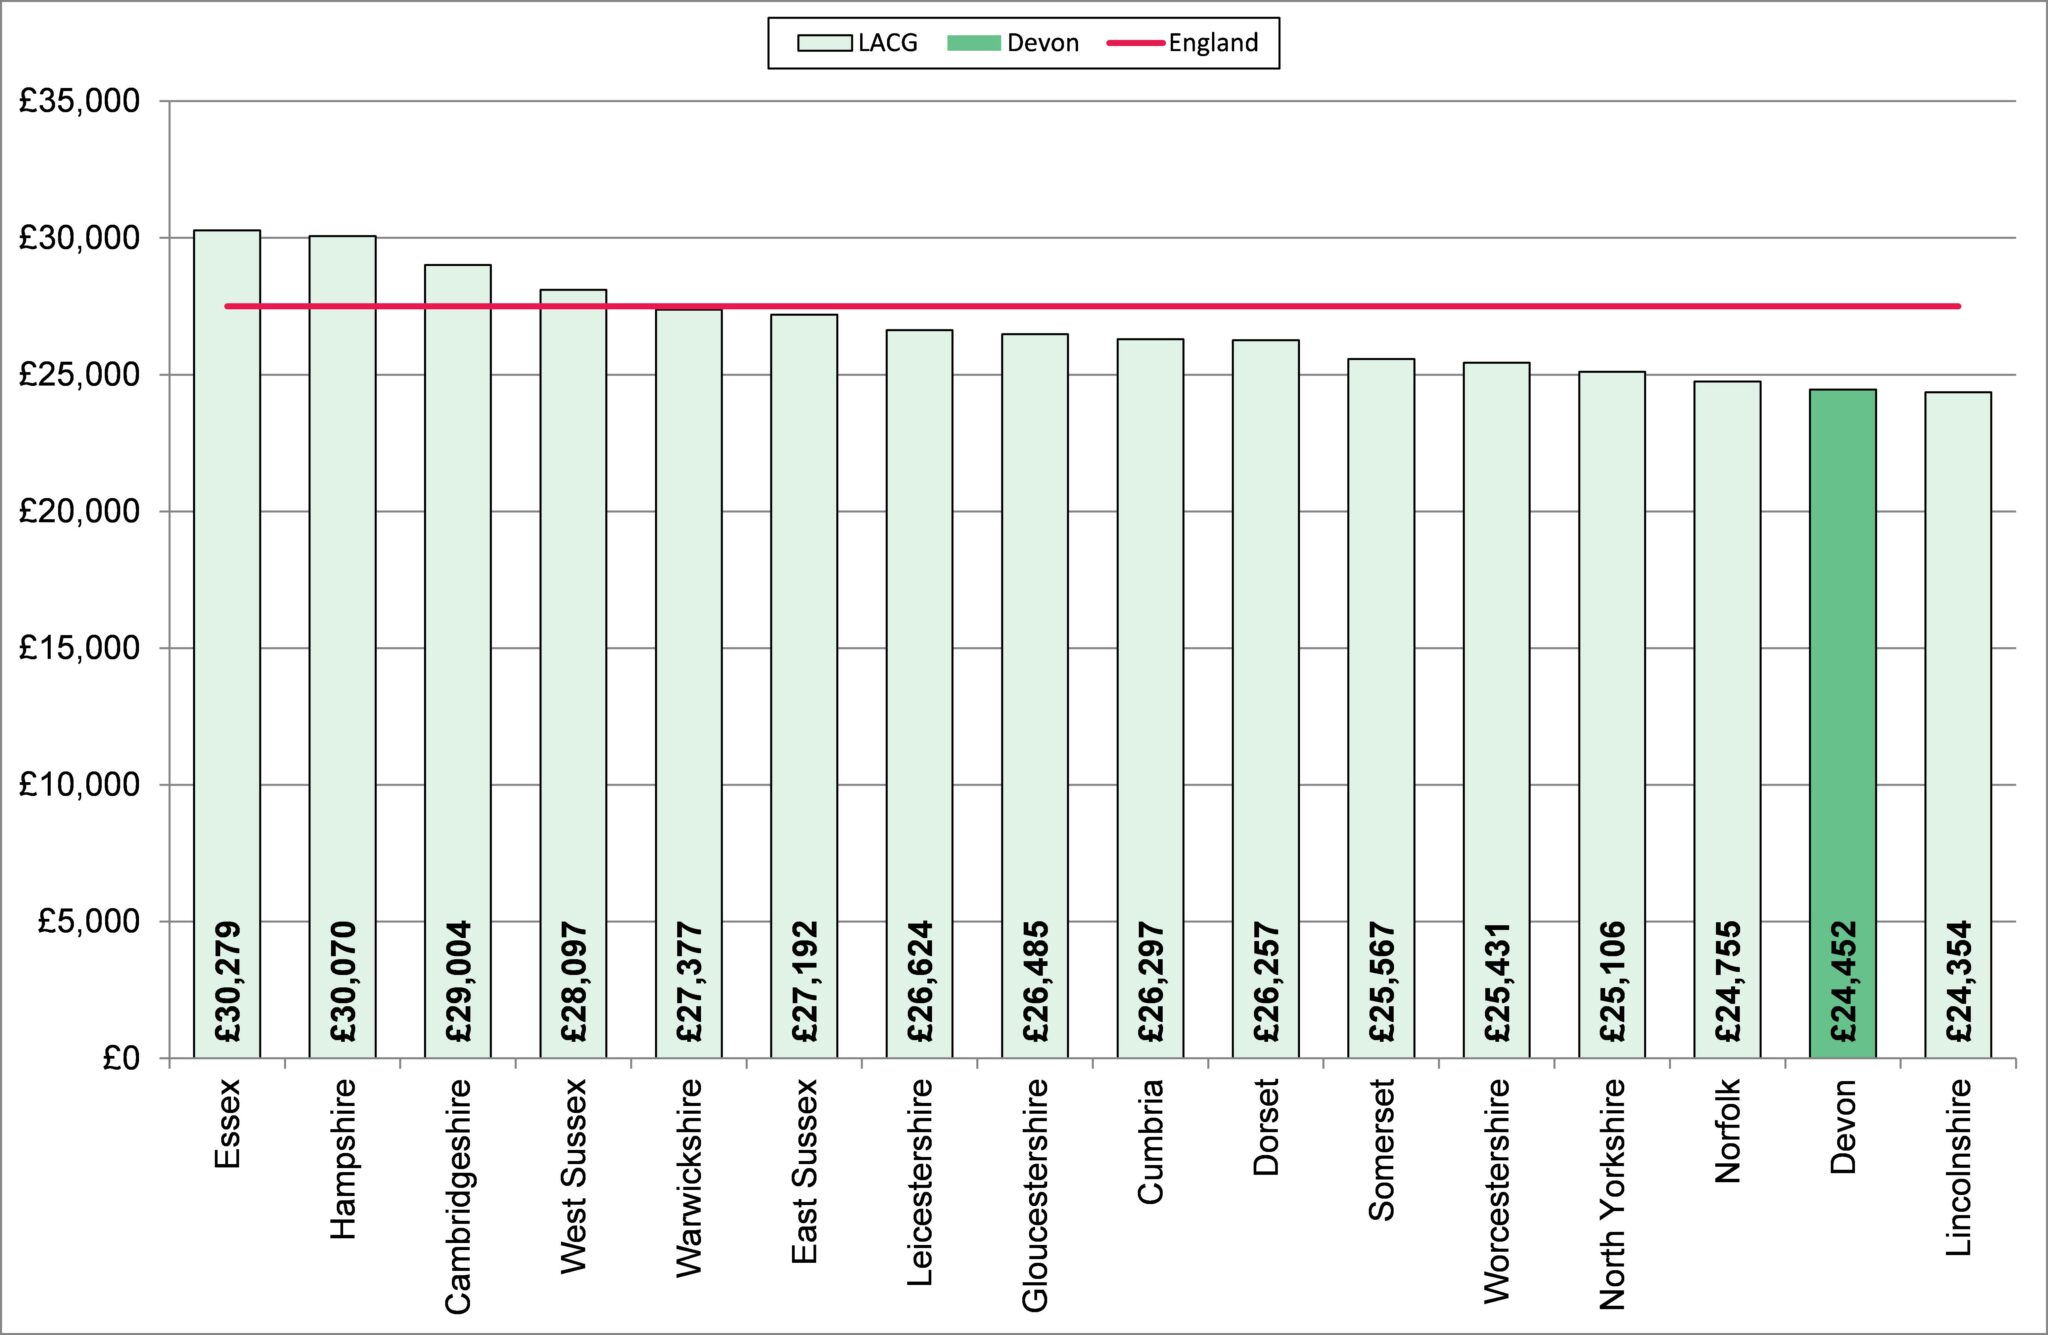
Source: Annual Survey of Hours and Earnings (ASHE), Office for National Statistics, 2014.
Figure 3.03: Percentage whose self-reported health was bad or very bad by age and income deprivation category, Devon, 2011.

Source: 2011 Census and Indices of Multiple Deprivation 2010
When the political tables turned again and a new Labour Government was elected in 1997, Sir Donald Acheson, the Chief Medical Officer, was commissioned to undertake a further independent inquiry into inequalities in health and noted that inequalities in health had persisted or widened. The Acheson Report made further recommendations[Acheson D. Independent Inquiry into Inequalities in Health. London: HMSO 1998.] but significantly focused on the need to address inequality in household income, and specifically poverty. This was the first time a report called for Government departments to check that their policies and programmes did not increase health inequality. Rather than absolute levels of income, it is the size of the gap in income across a population that is the most significant predictor of health inequality[Wilkinson, R. and Pickett, K. (2009). The Spirit Level: Why Equality is Better for Everyone. London: Allen Lane.]. To reduce health inequality, strategies to increase economic prosperity must benefit everyone, but particularly the worse-off.
Health inequality, therefore, is the result of less healthy lifestyles plus poorer living conditions but there is another factor at work which is of particular relevance to the health and care services. The “inverse care law” was described by Dr. Julian Tudor Hart, a General Practitioner from the South Wales mining village of Glyncorrwg, who observed inequality in access to health services as a contributory factor to inequalities in health. The inverse care law predicts that those people who have the greatest need for health services are the least likely to access them[Hart JT. The Inverse Care Law. Lancet 1971; i: 405-12.]. Adding this into the equation means that there is a critical role for the NHS in tackling health inequality, recognising that both the health-seeking behaviours and the provision of services will be worse for those people who have the greatest need.
Analyses of the causes of health inequality have shown that coronary heart disease, lung cancer and chronic obstructive pulmonary disease are big contributors to the differences. Although each area of Devon has a slightly different pattern, these main causes can be seen in all of them, as shown in Figure 3.04.
Figure 3.04: Conditions contributing to the gap in life expectancy between the most deprived and least deprived areas, for males and females by Devon area, 2013.
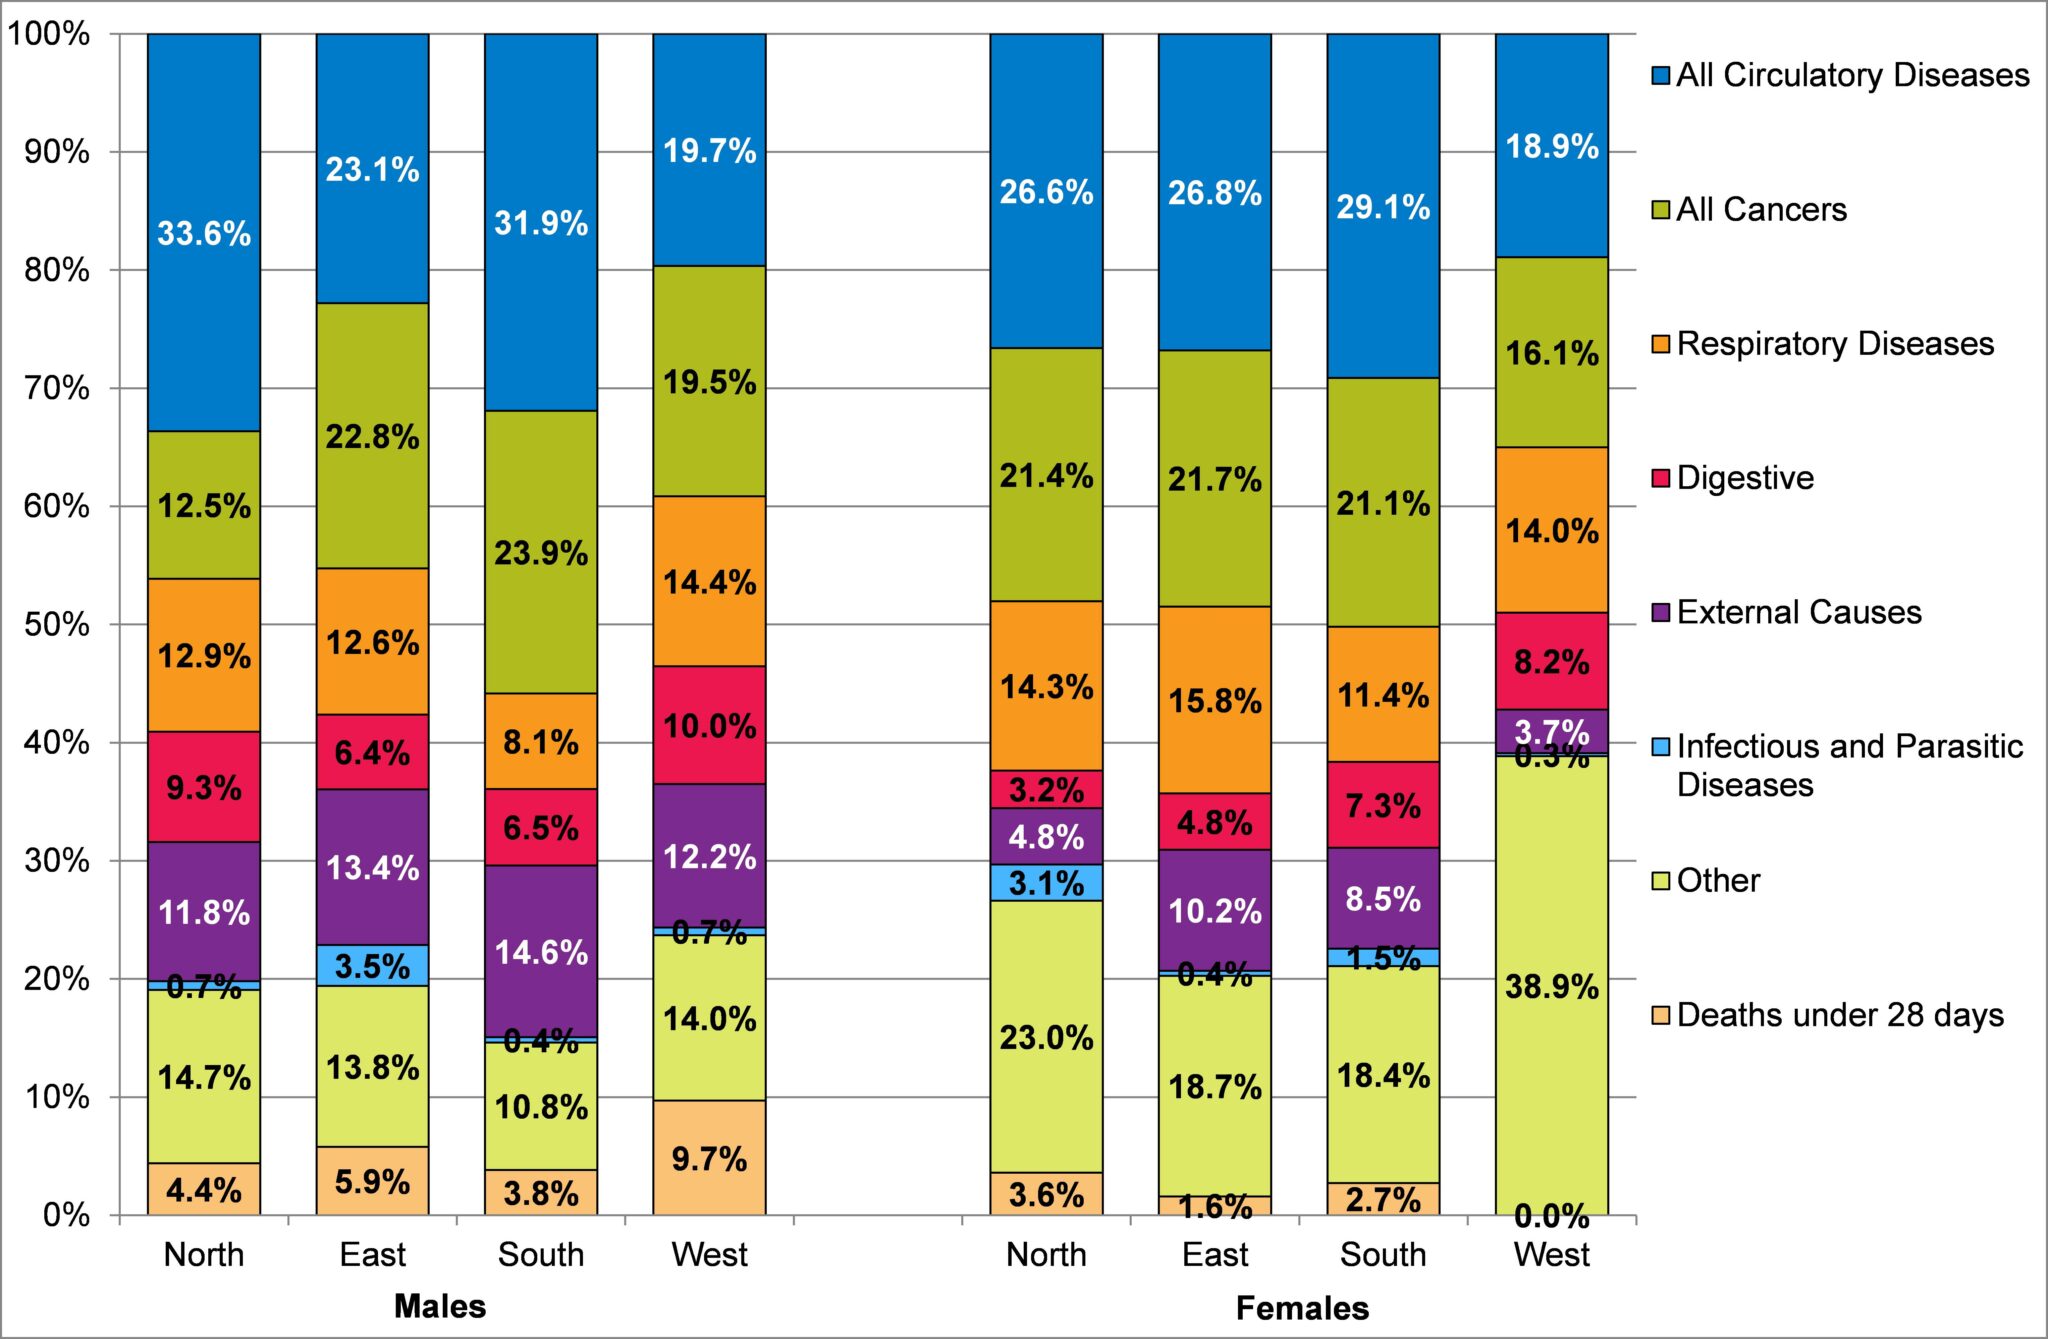
Source: Primary Care Mortality Database, 2014
One of the features of health inequalities is their relationship with social rather than genetic factors: the WHO Commission on the Social Determinants of Health in 2008 which was chaired by Professor Michael Marmot, reported that health-damaging experiences are not an inevitable part of life. Rather, they are “the result of a toxic combination of poor social policies and programmes, unfair economic arrangements, and bad politics” and “the conditions in which people are born, grow, live, work, and age”.[World Health Organization (2008) Closing the Gap in a Generation: Health equity through action on the social determinants of health. Geneva: WHO.] The solution to reducing health inequality is not an easy one – Professor David Hunter has described this as follows[Hunter D in: Campbell F. The social determinants of health and the role of local government. London: LGA/IDeA, 2010 (page 13).]:
“Regardless of the intentions of government, either national or local, to move ‘upstream’ and focus on the structural and social determinants of health, interventions all too often end up as small-scale projects or initiatives aimed at changing individual lifestyle behaviour and, in the process, failing to tackle the underlying health determinants on the scale needed to make a sustained impact at a population level. The ban on smoking in public places is a good example of an upstream intervention designed to tackle the problem on the scale required.”
Local government is better placed to achieve these environmental and community objectives than the NHS, working as it does across sectors and with its elected members contributing to local community leadership.