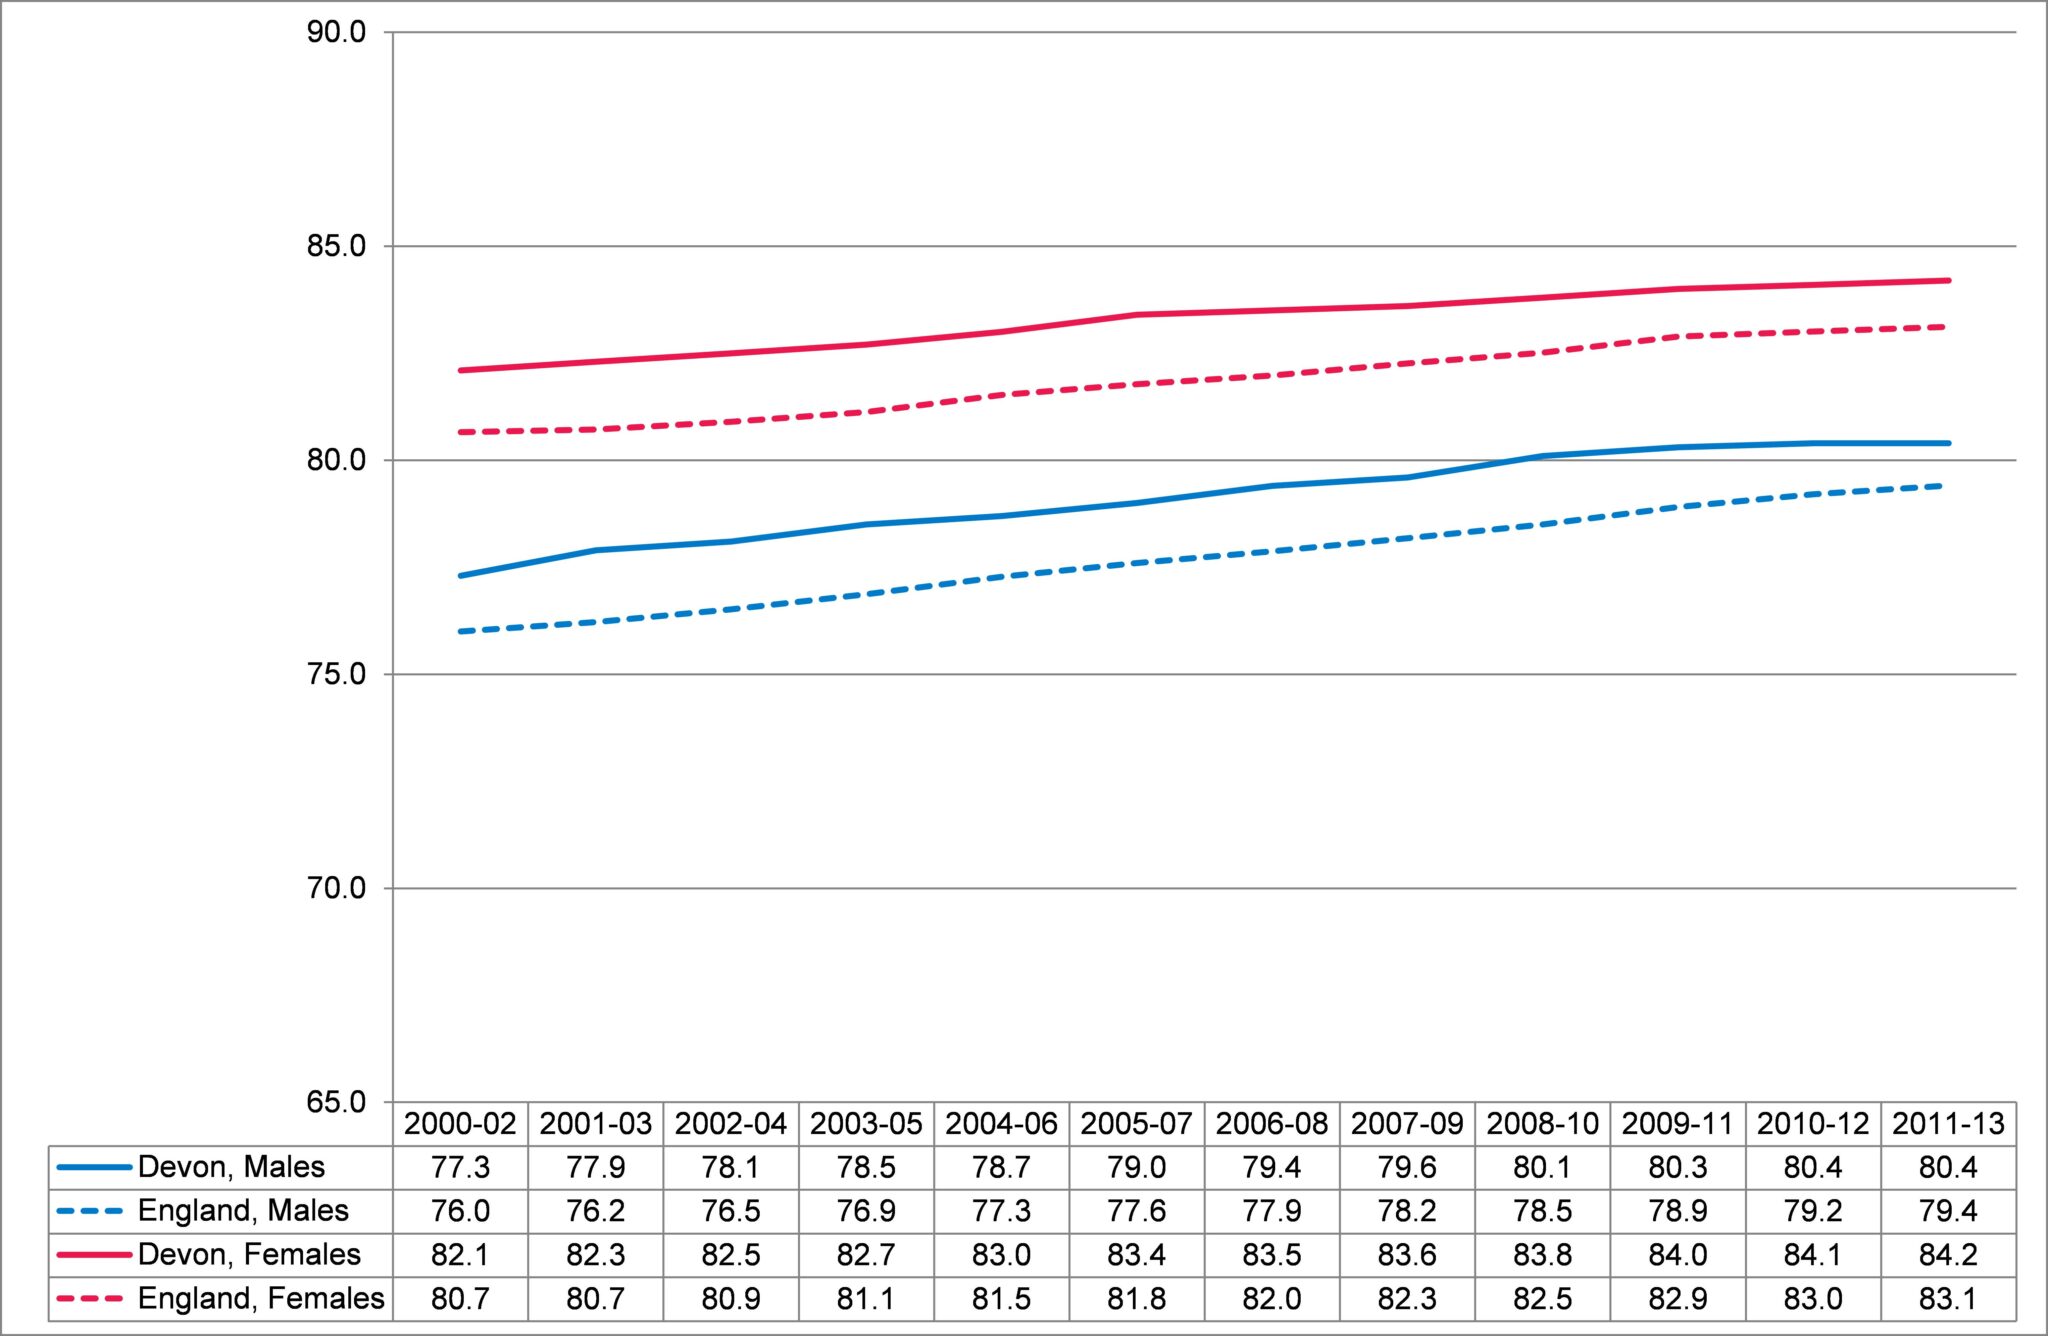
Life expectancy is the average period that a person can expect to live. Table 8.1 sets out the current average life expectancy in Devon, with males living 80.4 years and females living 84.2 years on average, a difference of 3.8 years. Figure 8.4 shows the trend in male and female life expectancy, highlighting that life expectancy has increased over recent years, and that life expectancy in Devon has been consistently above the England average.
Table 8.1, Average Life Expectancy at Birth in Years, Devon Local Authorities, 2011-13
| Area | Males | Females | ||
| Average Life Expectancy | 95% Confidence Interval | Average Life Expectancy | 95% Confidence Interval | |
| East Devon | 81.1 | (80.5 to 81.7) | 84.3 | (83.8 to 84.9) |
| Exeter | 79.8 | (79.2 to 80.3) | 83.9 | (83.3 to 84.6) |
| Mid Devon | 80.9 | (80.1 to 81.7) | 85.6 | (85.0 to 86.2) |
| North Devon | 79.7 | (78.9 to 80.4) | 83.2 | (82.6 to 83.8) |
| South Hams | 81.1 | (80.4 to 81.8) | 85.3 | (84.7 to 85.9) |
| Teignbridge | 80.1 | (79.5 to 80.6) | 84.2 | (83.7 to 84.8) |
| Torridge | 80.5 | (79.8 to 81.3) | 82.5 | (81.7 to 83.3) |
| West Devon | 79.4 | (78.4 to 80.4) | 84.8 | (84.2 to 85.3) |
| Devon | 80.4 | (80.2 to 80.7) | 84.2 | (84.0 to 84.4) |
| South West | 80.1 | (80.0 to 80.2) | 83.8 | (83.8 to 83.9) |
| England | 79.4 | (79.4 to 79.4) | 83.1 | (83.1 to 83.2) |
Source: Health and Social Care Information Centre, Compendium of Population Health Indicators, 2015
Figure 8.4, Trend in Average Life Expectancy in Years in Devon and England, 2000-02 to 2011-13
Source: Health and Social Care Information Centre, Compendium of Population Health Indicators, 2015
Substantial differences in average life expectancy exist within Devon, with shorter life expectancy seen in more deprived areas and areas with a high concentration of care homes. The shortest life expectancy at ward level in Devon is in Ilfracombe Central (74.6 years) which is 15 years less than the life expectancy in Newton Poppleford and Harpford in East Devon (89.6 years). Life expectancy is also significantly lower in certain groups including gypsies and travellers, the homeless and persons with moderate or severe learning disabilities.
Table 8.2, Overall, shortest and longest average life expectancy in years (LE) at birth by ward, Devon local authority districts, 2009 to 2013.
| District | Overall LE | Shortest LE | Longest LE | Gap (years) | ||
| Ward Name | LE | Name | LE | |||
| East Devon | 82.8 | Exmouth Littleham | 80.0 | Newton Poppleford and Harpford | 89.6 | 9.6 |
| Exeter | 81.8 | Newtown | 77.4 | Topsham | 85.9 | 8.5 |
| Mid Devon | 83.0 | Cullompton North | 79.6 | Upper Culm | 85.9 | 6.3 |
| North Devon | 81.5 | Ilfracombe Central | 74.6 | Chittlehampton | 87.7 | 13.1 |
| South Hams | 82.9 | Totnes Bridgetown | 79.0 | Marldon | 86.7 | 7.7 |
| Teignbridge | 82.1 | Newton Abbot: College | 78.8 | Kerswell-with-Combe | 86.1 | 7.3 |
| Torridge | 81.8 | Kenwith | 79.6 | Three Moors | 89.2 | 9.6 |
| West Devon | 82.1 | Okehampton West | 79.7 | Milton Ford | 86.1 | 6.4 |
| Devon | 82.3 | Ilfracombe Central | 74.6 | Newton Poppleford and Harpford | 89.6 | 15.0 |
Source: Primary Care Mortality Database 2014 and Office for National Statistics Mid-Year Population Estimates