The Early Years Foundation Stage (EYFS) Profile collects data on the development of children aged five, based on teacher assessments of individual children. These are reported annually to the Department for Education. In Devon, the proportion of children achieving the expected level of development through the EYFS was 67% which is above the South West average of 61% and the national average of 58%. There is however variation between districts with 58.7% in Mid Devon and 70.8% in South Hams. The results record various areas of development, including communication, physical development, personal, social and emotional development, literacy, mathematics, understanding the world and expressive arts, designing and making. Devon results in all areas are higher than nationally and in the South West (Source: Department for Education).
Figure 8.5, Early Years Foundation Stage Profile 2013-14, Overall Development Scores
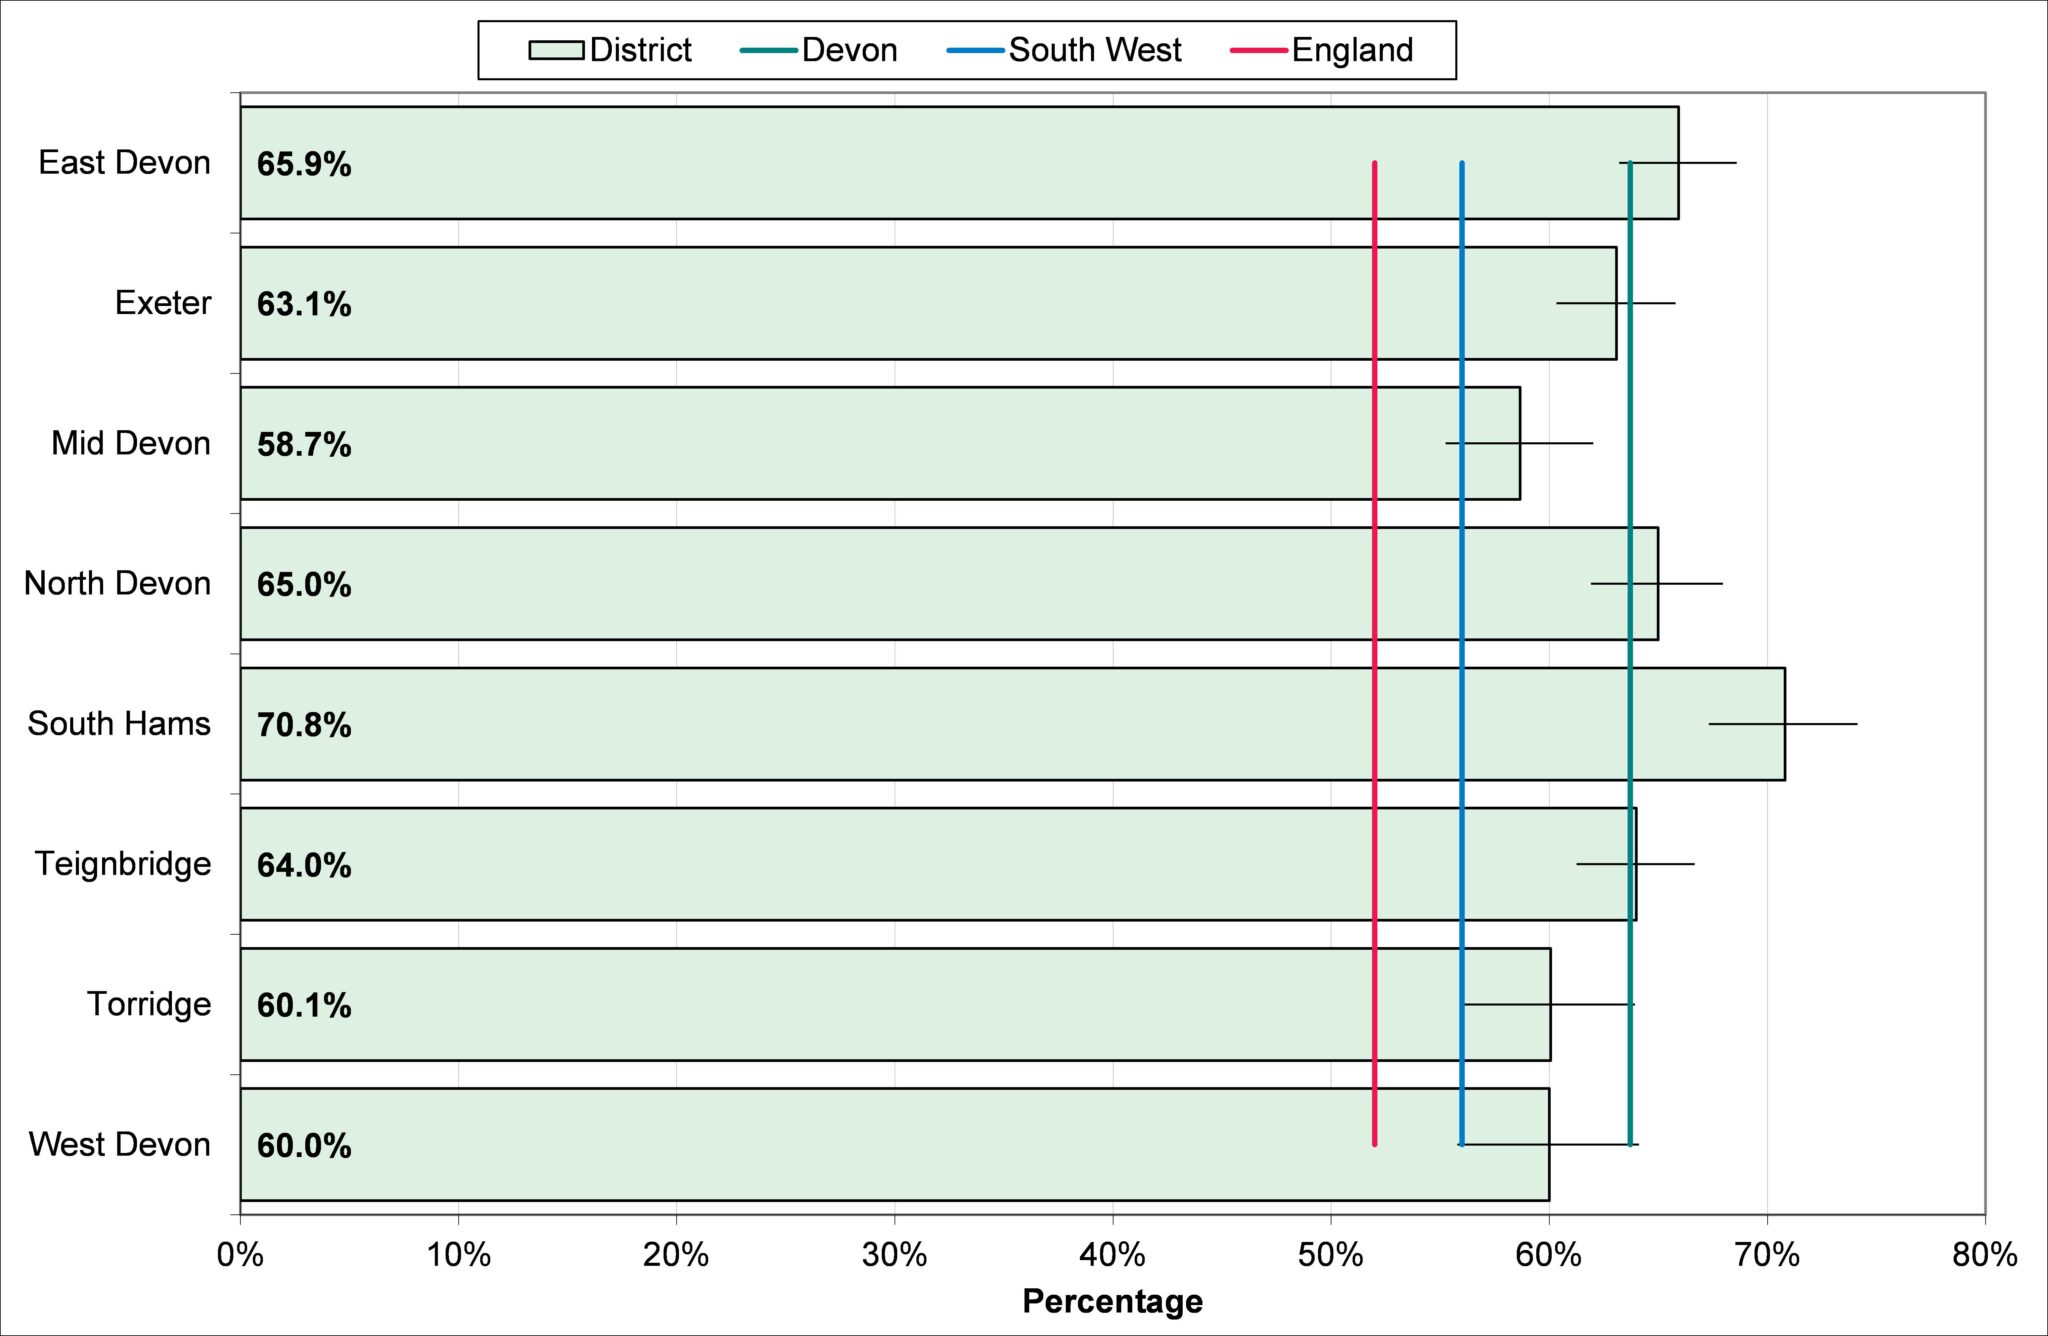
Source: Department for Education, 2014
Level 4 is the recommended level of achievement at Key Stage Two (year six, aged 10 to 11). Pupils in Devon have consistently achieved a higher proportion of level 4 and level 5 than nationally and have also increased year on year. There is however still a difference in achievement between girls and boys, with higher proportions of girls achieving both level 4 and 5 than boys.
Table 8.4, Key stage 2 attainment in reading, writing and mathematics
| Percentage achieving level 4 or above | |||||||||
| 2012 | 2013 | 2014 | |||||||
| All | Boy | Girls | All | Boy | Girls | All | Boy | Girls | |
| Devon | 78% | 75% | 81% | 77% | 73% | 82% | 81% | 78% | 84% |
| South West | 75% | 71% | 79% | 76% | 72% | 80% | 79% | 76% | 82% |
| England | 75% | 71% | 79% | 75% | 72% | 79% | 79% | 76% | 82% |
| Percentage achieving level 5 or above | |||||||||
| 2012 | 2013 | 2014 | |||||||
| All | Boys | Girls | All | Boys | Girls | All | Boys | Girls | |
| Devon | 22% | 19% | 26% | 23% | 20% | 28% | 26% | 22% | 30% |
| South West | 21% | 17% | 24% | 22% | 18% | 25% | 23% | 20% | 26% |
| England | 20% | 17% | 23% | 21% | 18% | 25% | 24% | 20% | 27% |
Source: Department for Education, 2014
Achievement data for 5 or more GCSEs or equivalent had shown an upward trend nationally and although achievement levels were slightly lower in Devon, the trend was increasing. In 2013/14 there have been major reforms that have had an impact on the performance measures and this can be seen in the data in table 8.5 below for 2013/14. There were some changes in relation to vocational qualifications in relation to what is included, the point scores they count for and how many count towards performance measures. There were also changes to how early entries counted within performance measures and the results show clearly these changes have reduced the percentage with five or more GCSE or equivalent. It is therefore no possible to compare the results from 2013/14 in a trend over time. Further changes to the curriculum are expected and so data is included for this year, but further changes are likely in the future.
Table 8.5, Trends in pupils attaining five or more GCSEs at grades A* to C, Devon, 2005-06 to 2013-14
| Area | 2005-06 | 2006-07 | 2007-08 | 2008-09 | 2009-10 | 2010-11 | 2011-12 | 2012-13 | 2013-14 |
| Devon | 58.0% | 57.3% | 63.5% | 65.9% | 68.7% | 73.8% | 77.9% | 78.0% | 67.4% |
| South West | 58.2% | 59.5% | 63.6% | 67.9% | 72.7% | 76.8% | 79.8% | 79.8% | 65.8% |
| England | 59.0% | 61.4% | 65.3% | 70.0% | 75.4% | 79.6% | 81.9% | 81.8% | 63.2% |
Source: Department for Education, 2014