Human migration is the movement by people from one place to another with the intention of settling temporarily or permanently in the new location. A distinction is made between international migration, where people move from one country to another, and internal migration which covers movements within a country. Table 3.2 highlights the flow of international and internal migration into and out of Devon from 2004 to 2013. This does not include movements within the Devon County Council area from one address to another. This reveals internal migration is much more significant locally than international migrations, with more than nine times the number of internal movements than international movements. More people move into Devon (inflow) than out (outflow), contributing to population growth locally. The net flow of internal migrants is around 4,000 per annum in Devon, and the net flow of international migrants has stood at around 2,000 per annum for the last three years.
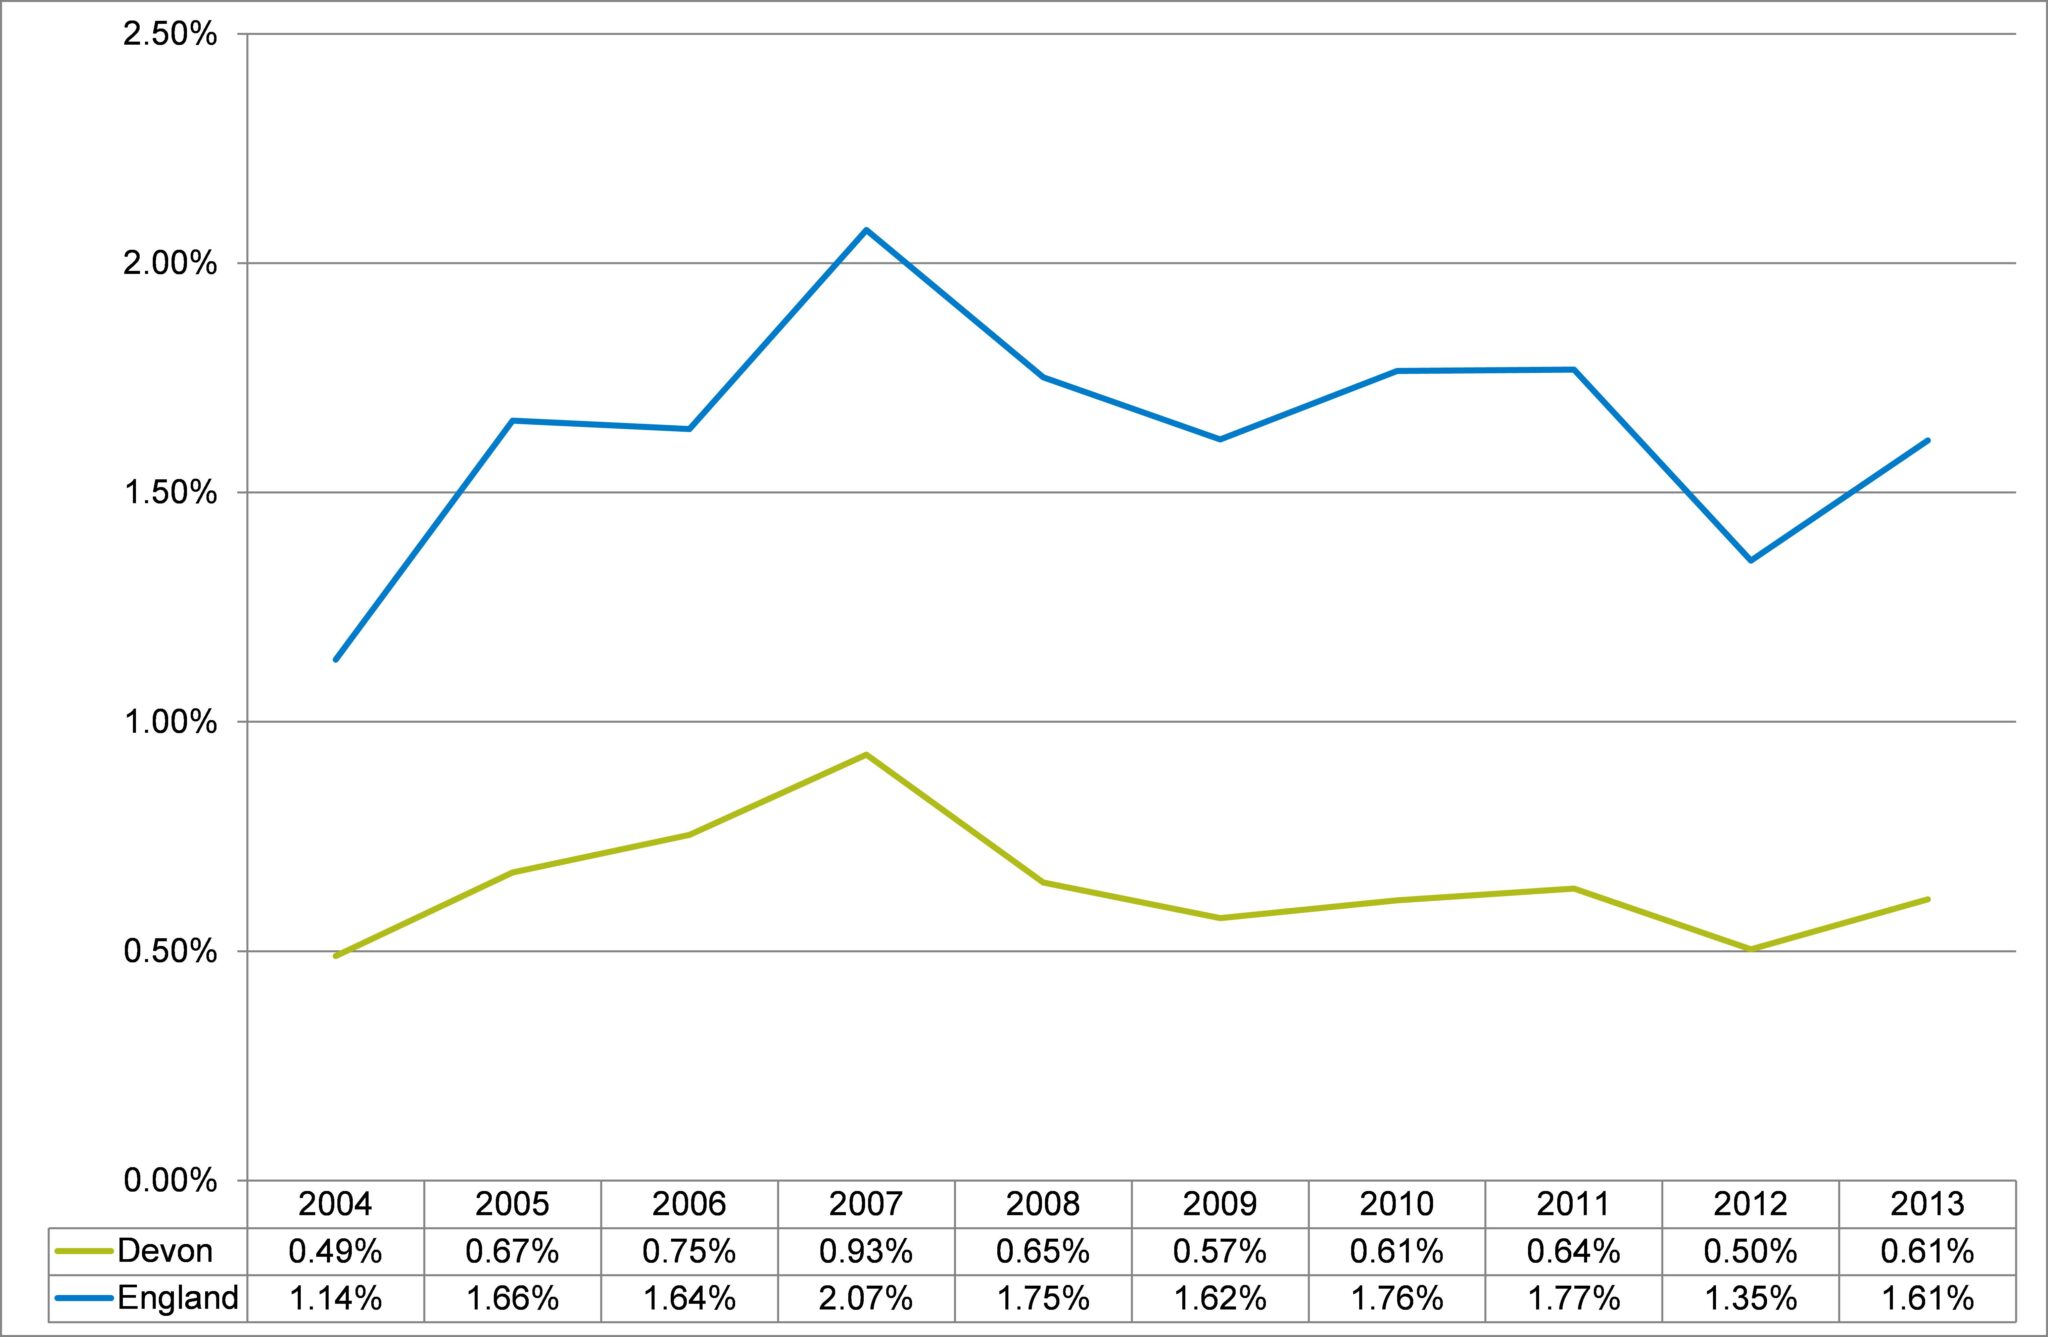
New National Insurance Number Registrations for international migrants give a further indication of migration patterns amongst those who are economically active. This is shown in figure 3.8 as a percentage of the working-age population (aged 16 to 64). The pattern in Devon has been relatively stable since 2008, falling from a peak of 0.93% in 2007 to 0.61% in 2013. The level of new registrations in Devon is less than half of the national rate (1.61% in 2013).
Table 3.2, International and Internal Migration into and out of Devon, 2004 to 2013
| Year | Population | International Migration | Internal Migration | ||||
| Inflow | Outflow | Net flow | Inflow | Outflow | Net flow | ||
| 2004 | 718,800 | 3,600 | 4,000 | -400 | 35,600 | 27,300 | +8,300 |
| 2005 | 725,600 | 6,900 | 3,300 | +3,600 | 32,600 | 26,900 | +5,700 |
| 2006 | 729,600 | 3,700 | 3,600 | +100 | 33,300 | 27,500 | +5,800 |
| 2007 | 736,300 | 4,400 | 2,800 | +1,600 | 34,700 | 27,700 | +7,000 |
| 2008 | 739,900 | 3,500 | 4,600 | -1,100 | 33,200 | 27,100 | +6,100 |
| 2009 | 741,000 | 3,800 | 4,800 | -1,000 | 30,400 | 26,600 | +3,800 |
| 2010 | 743,900 | 4,000 | 3,000 | +1,000 | 30,100 | 26,800 | +3,300 |
| 2011 | 747,700 | 4,700 | 2,800 | +1,900 | 30,300 | 27,000 | +3,300 |
| 2012 | 753,200 | 3,800 | 1,900 | +1,900 | 31,400 | 27,200 | +4,200 |
| 2013 | 758,100 | 4,000 | 2,000 | +2,000 | 30,200 | 26,400 | +3,800 |
Source: Office for National Statistics, Migration by Local Authorities in England & Wales, 2014
Figure 3.8, New Migrant National Insurance Number Registrations as a percentage of persons aged 16 to 64, Devon vs England, 2004 to 2013
Source: Office for National Statistics, Migration by Local Authorities in England & Wales, 2014
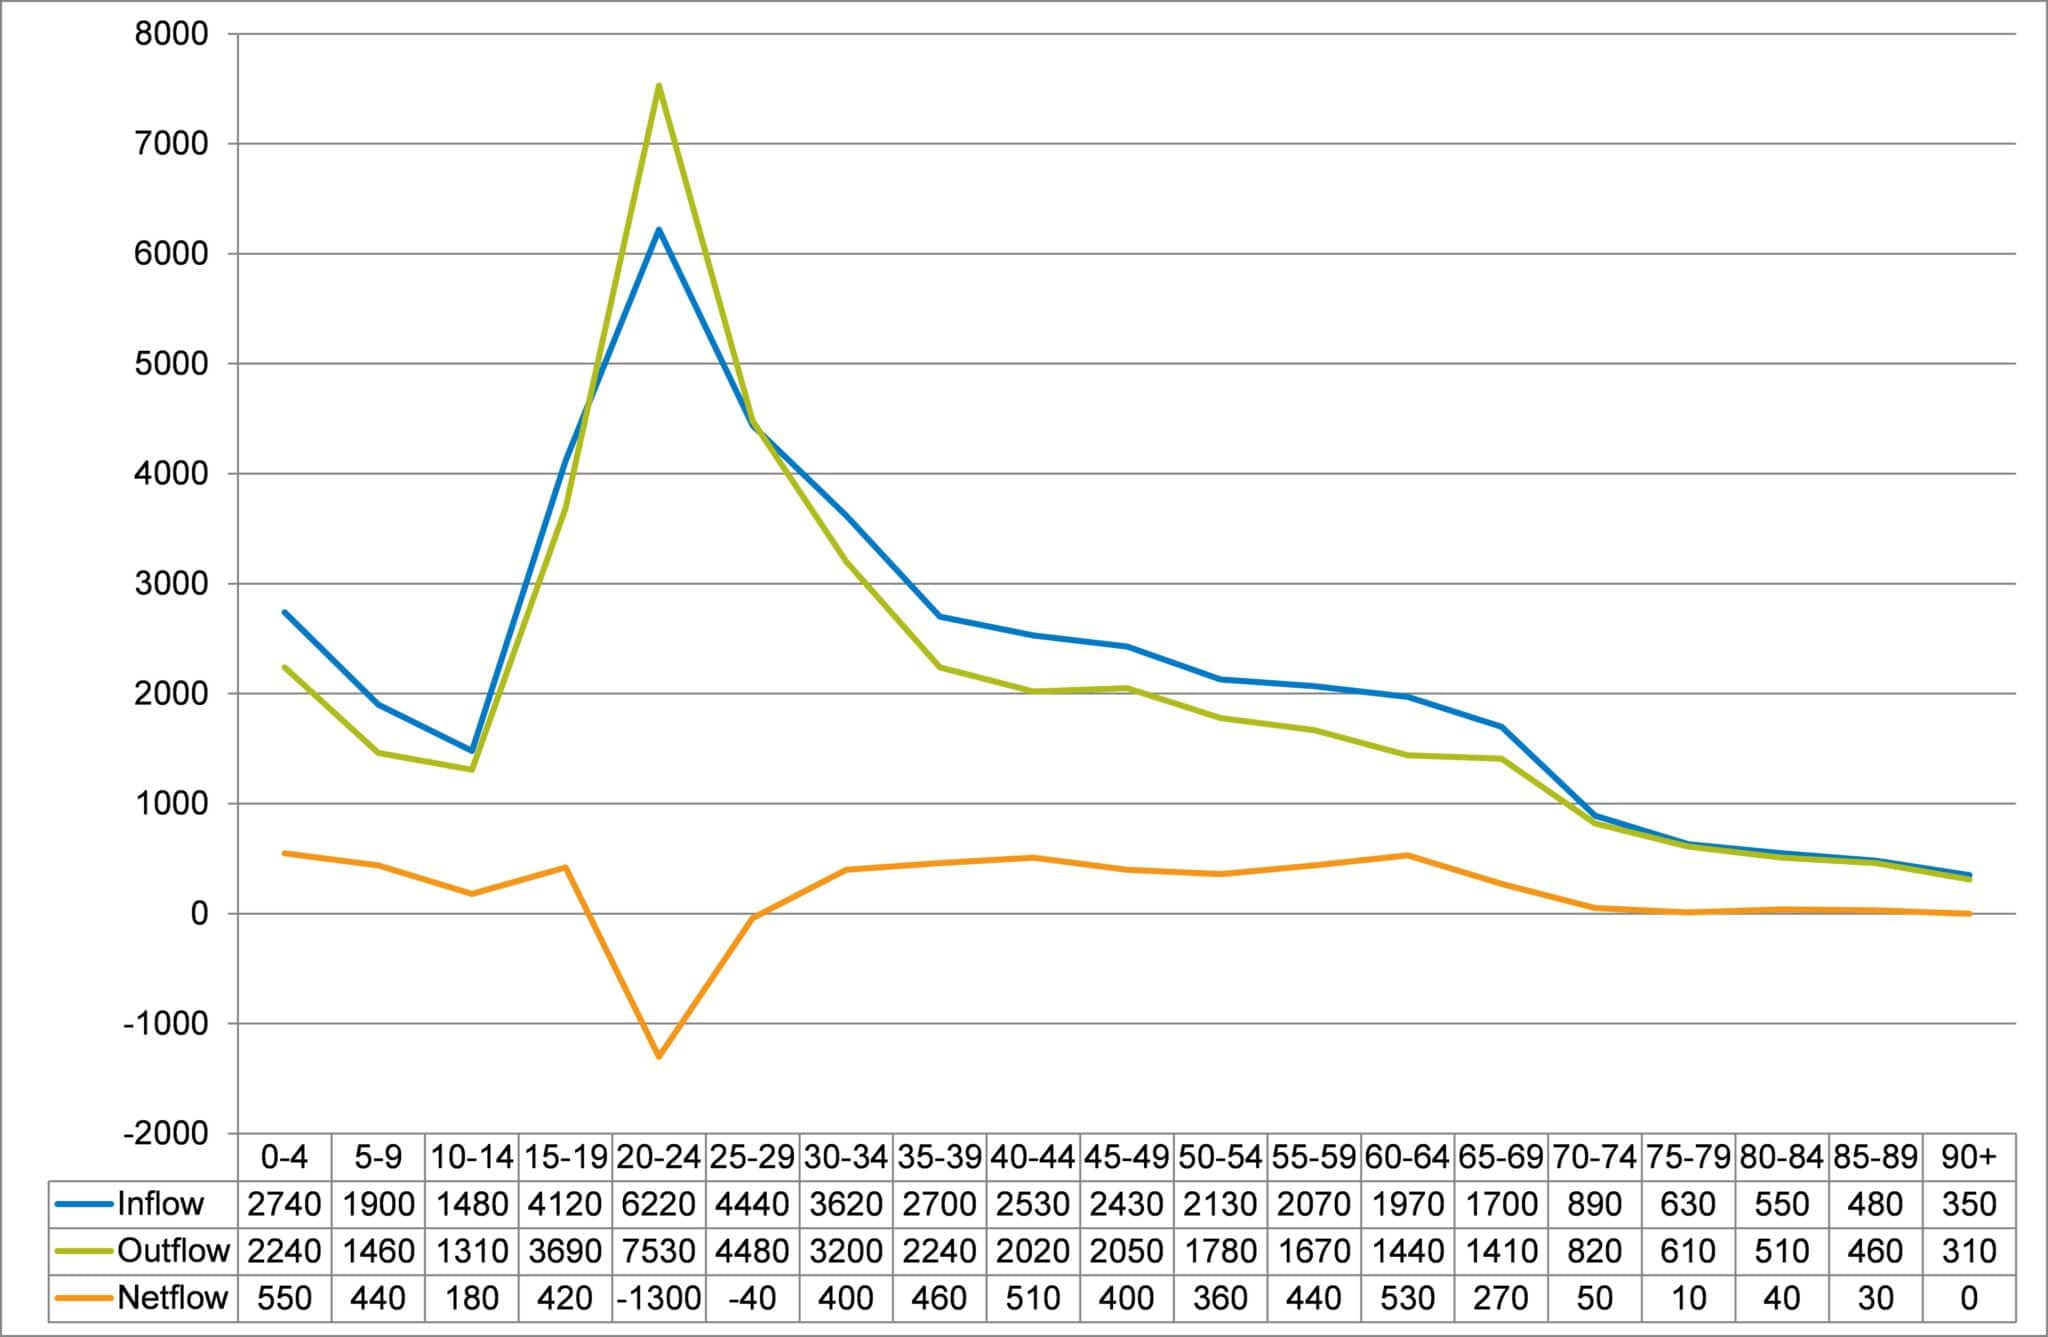
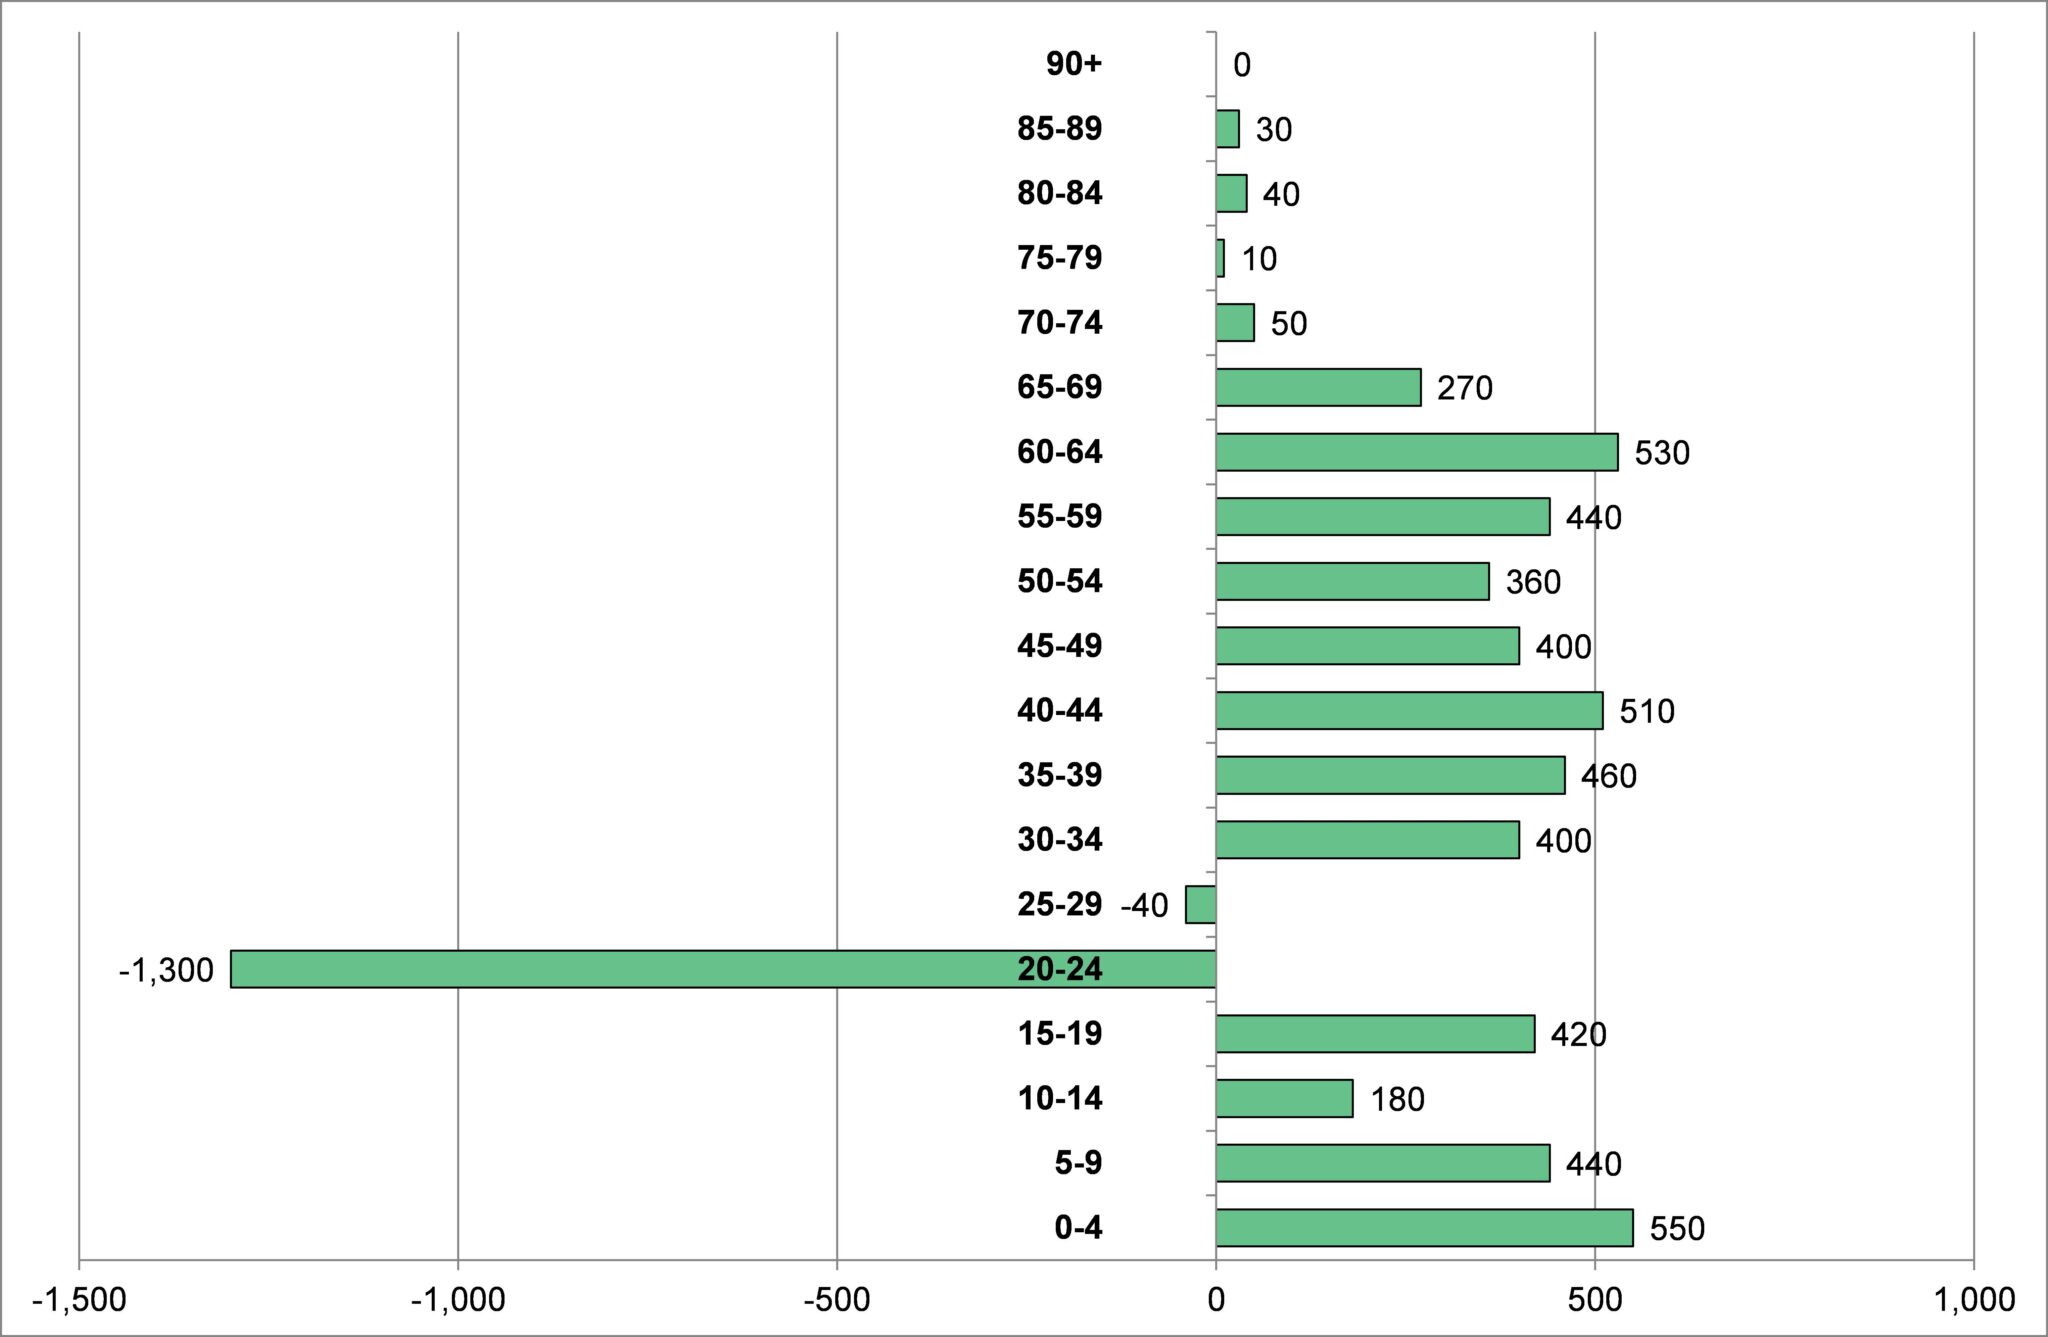
Figures 3.9 and 3.10 shows the pattern of internal migration into and out of Devon by age group in 2013. The only age groups in which more people leave Devon than arrive are the 20 to 29 age groups, which is largely due to people leaving to attend university or employment. High net flows contributing to population growth in Devon are seen in the 30 to 69 age group, which also contributes to higher net flows in under 20s as people move to Devon later in their working life or at retirement. The net flow for those aged 70 and over is relatively low.
Figure 3.9, Internal Migration into and out of Devon by Age Group during 2013
Source: Office for National Statistics, Migration by Local Authorities in England & Wales, 2014
Figure 3.10, Net Internal Migration by Age Group during 2013
Source: Office for National Statistics, Migration by Local Authorities in England & Wales, 2014
A further analysis of internal migration reveals movements by region into and out of Devon. As table 3.3 reveals, as around 42% of movements in and 46% of movements out are within the South West, the pattern is fairly even and the net flow relatively low (+422). The largest net flow is from the South East (+1,466), with fairly sizeable net flows from the East of England (+543), and the West Midlands (+482). Table 3.4 shows net migration by age group and region for 2013. This highlights a significant net flow of people from Devon to London in the 16 to 39 age group (-558), with higher net flows from London to Devon in other age groups.
Table 3.3, Internal Migration into and out of Devon by Region during 2013
| Region | Movements In | Movements Out | Net Flow |
| East Midlands | 1,139 | 1,001 | 138 |
| East of England | 1,949 | 1,406 | 543 |
| London | 2,779 | 2,504 | 275 |
| North East | 224 | 246 | -22 |
| North West | 1,156 | 819 | 337 |
| Northern Ireland | 77 | 83 | -6 |
| Scotland | 460 | 505 | -44 |
| South East | 5,670 | 4,204 | 1,466 |
| South West | 12,622 | 12,199 | 422 |
| Wales | 1,274 | 1,235 | 39 |
| West Midlands | 2,022 | 1,540 | 482 |
| Yorkshire and The Humber | 853 | 704 | 149 |
| All Regions | 30,225 | 26,446 | 3,780 |
Source: Office for National Statistics, Migration by Local Authorities in England & Wales, 2014
Table 3.4, Net Migration into and out of Devon by Region and Age Group during 2013
| Region | 00 to 15 | 16 to 39 | 40 to 64 | 65 and over | Total |
| East Midlands | 17 | -6 | 88 | 39 | 138 |
| East of England | 126 | 124 | 276 | 18 | 543 |
| London | 224 | -558 | 440 | 169 | 275 |
| North East | 12 | -42 | 0 | 8 | -22 |
| North West | 71 | 95 | 160 | 11 | 337 |
| Northern Ireland | -13 | 16 | -6 | -2 | -6 |
| Scotland | -11 | 2 | -37 | 1 | -44 |
| South East | 305 | 201 | 792 | 168 | 1,466 |
| South West | 317 | -63 | 251 | -82 | 422 |
| Wales | -21 | 63 | -9 | 6 | 39 |
| West Midlands | 93 | 77 | 224 | 89 | 482 |
| Yorkshire and The Humber | 43 | 37 | 37 | 33 | 149 |
| All Regions | 1,161 | -55 | 2,216 | 458 | 3,780 |
Source: Office for National Statistics, Migration by Local Authorities in England & Wales, 2014