Although Dementia is a common condition in older people, managing it can be hard for both the sufferer and family and friends around them. Although it can affect people at a younger age it predominantly affects people aged over 65. Devon has an older than average population and is also showing stronger population growth in the older age groups. Dementia prevalence rates are higher in females. This, coupled with longer life expectancy, means females with dementia outnumber males by more than two to one. Prevalence rates for dementia increase rapidly with age, with one in 1400 affected under the age of 65, compared with more than one in five in those aged 85 and over.
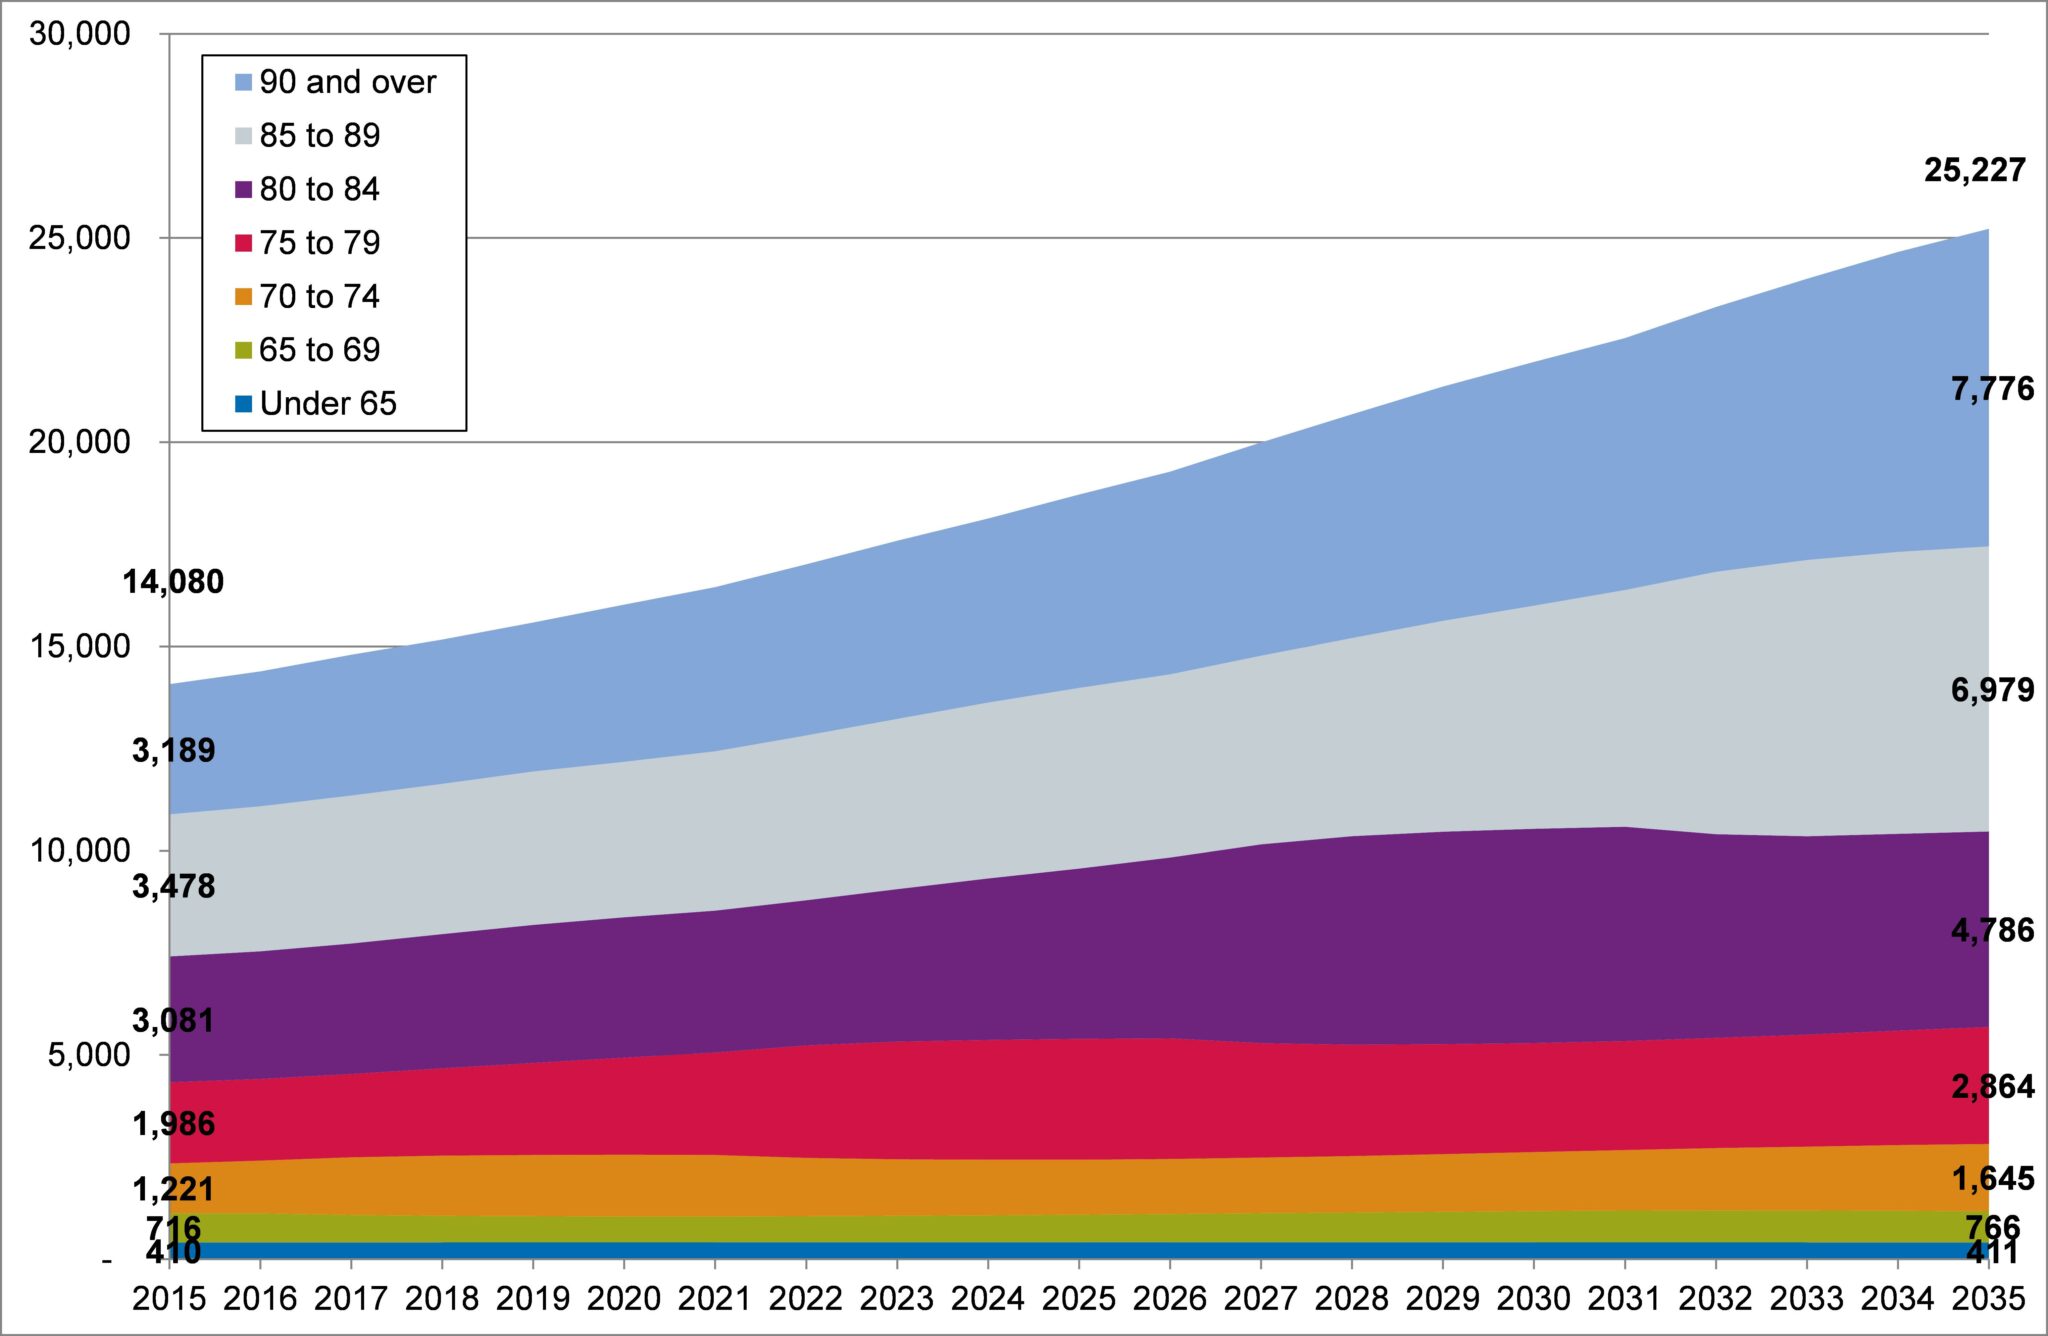
Table 10.7 shows the projected number of people with dementia between 2015 and 2035 by Devon local authority district. This highlights that around 14,080 people living in Devon are estimated to have dementia in 2015, representing 1.84% of the population, which is set to rise to 25,227 by 2035, when it will affect around 2.97% of the population. Districts with an older age profile such as East Devon have a higher percentage of the population living with dementia. Figure 10.14 provides an age breakdown for the dementia projections for Devon, highlighting the impact by age group. This shows that the biggest shifts over the next 20 years will be in the 90 and over age group.
Table 10.7, Projected number and percentage of total population with dementia by Devon local authority district, 2015 to 2035
| District | 2015 | 2020 | 2025 | 2030 | 2035 |
| East Devon | 3257 (2.39%) | 3619 (2.58%) | 4128 (2.85%) | 4839 (3.25%) | 5516 (3.62%) |
| Exeter | 1629 (1.34%) | 1809 (1.46%) | 2045 (1.61%) | 2336 (1.79%) | 2628 (1.98%) |
| Mid Devon | 1629 (1.34%) | 1809 (1.46%) | 2045 (1.61%) | 2336 (1.79%) | 2628 (1.98%) |
| North Devon | 1311 (1.64%) | 1496 (1.81%) | 1796 (2.11%) | 2109 (2.42%) | 2414 (2.71%) |
| South Hams | 1696 (1.79%) | 1954 (2.01%) | 2302 (2.32%) | 2715 (2.67%) | 3071 (2.97%) |
| Teignbridge | 1549 (1.84%) | 1737 (2.03%) | 2080 (2.39%) | 2447 (2.76%) | 2806 (3.14%) |
| Torridge | 2446 (1.93%) | 2747 (2.11%) | 3238 (2.41%) | 3810 (2.77%) | 4383 (3.12%) |
| West Devon | 1174 (1.77%) | 1381 (1.99%) | 1661 (2.3%) | 1979 (2.65%) | 2292 (2.99%) |
| Devon | 14080 (1.84%) | 16026 (2.04%) | 18721 (2.31%) | 21967 (2.64%) | 25227 (2.97%) |
Source: ONS Sub-National Population Projections, 2014 and Dementia UK Prevalence Estimates, 2007
Figure 10.14, Projected number with dementia by age group and year, Devon, 2015 to 2035
Source: ONS Sub-National Population Projections, 2014 and Dementia UK Prevalence Estimates, 2007
Table 10.8 displays the 10 Devon wards with the highest expected dementia prevalence in 2013. This reveals that the top five wards for dementia prevalence in Devon are in East Devon, with the highest rate seen in the Sidmouth Town ward (4.55%).
Table 10.8, Top 10 Devon Wards for Expected Prevalence of Dementia, 2013
| Ward | District | Estimated number with dementia | Population | Estimated % with dementia |
| Sidmouth Town | East Devon | 236 | 5,195 | 4.55% |
| Seaton | East Devon | 261 | 7,177 | 3.64% |
| Exmouth Littleham | East Devon | 263 | 7,250 | 3.63% |
| Budleigh | East Devon | 210 | 5,903 | 3.56% |
| Sidmouth Rural | East Devon | 70 | 2,176 | 3.20% |
| Teignmouth East | Teignbridge | 149 | 4,939 | 3.02% |
| Bishopsteignton | Teignbridge | 79 | 2,623 | 3.00% |
| Kingsbridge East | South Hams | 62 | 2,052 | 3.00% |
| Sidmouth Sidford | East Devon | 188 | 6,629 | 2.84% |
| Orchard Hill | Torridge | 48 | 1,700 | 2.83% |
Source: ONS Mid-Year Population Estimates, 2014 and Dementia UK Prevalence Estimates, 2007
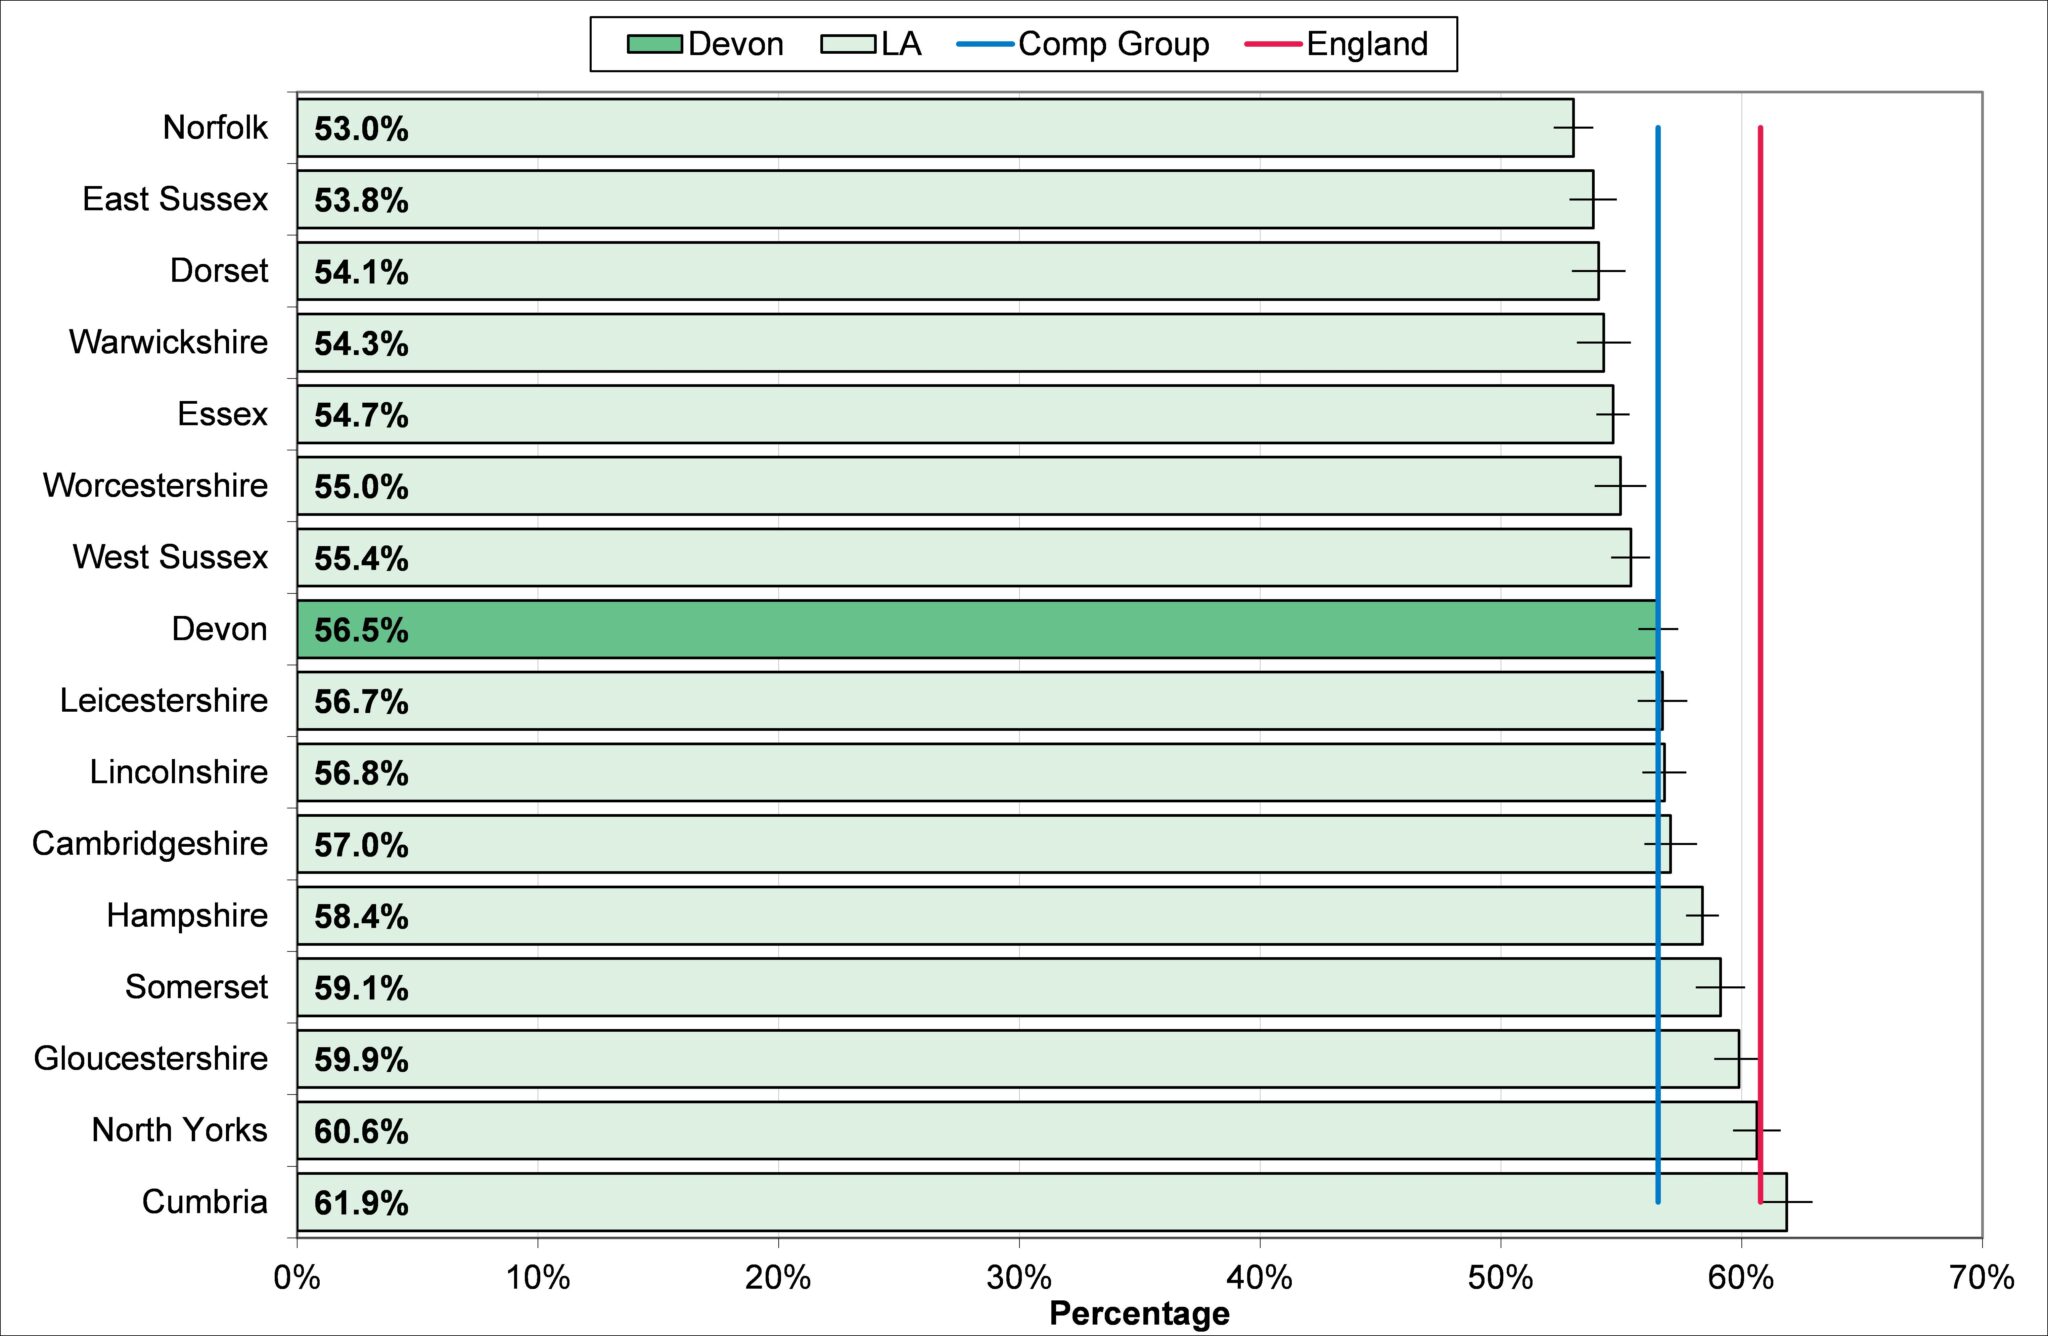
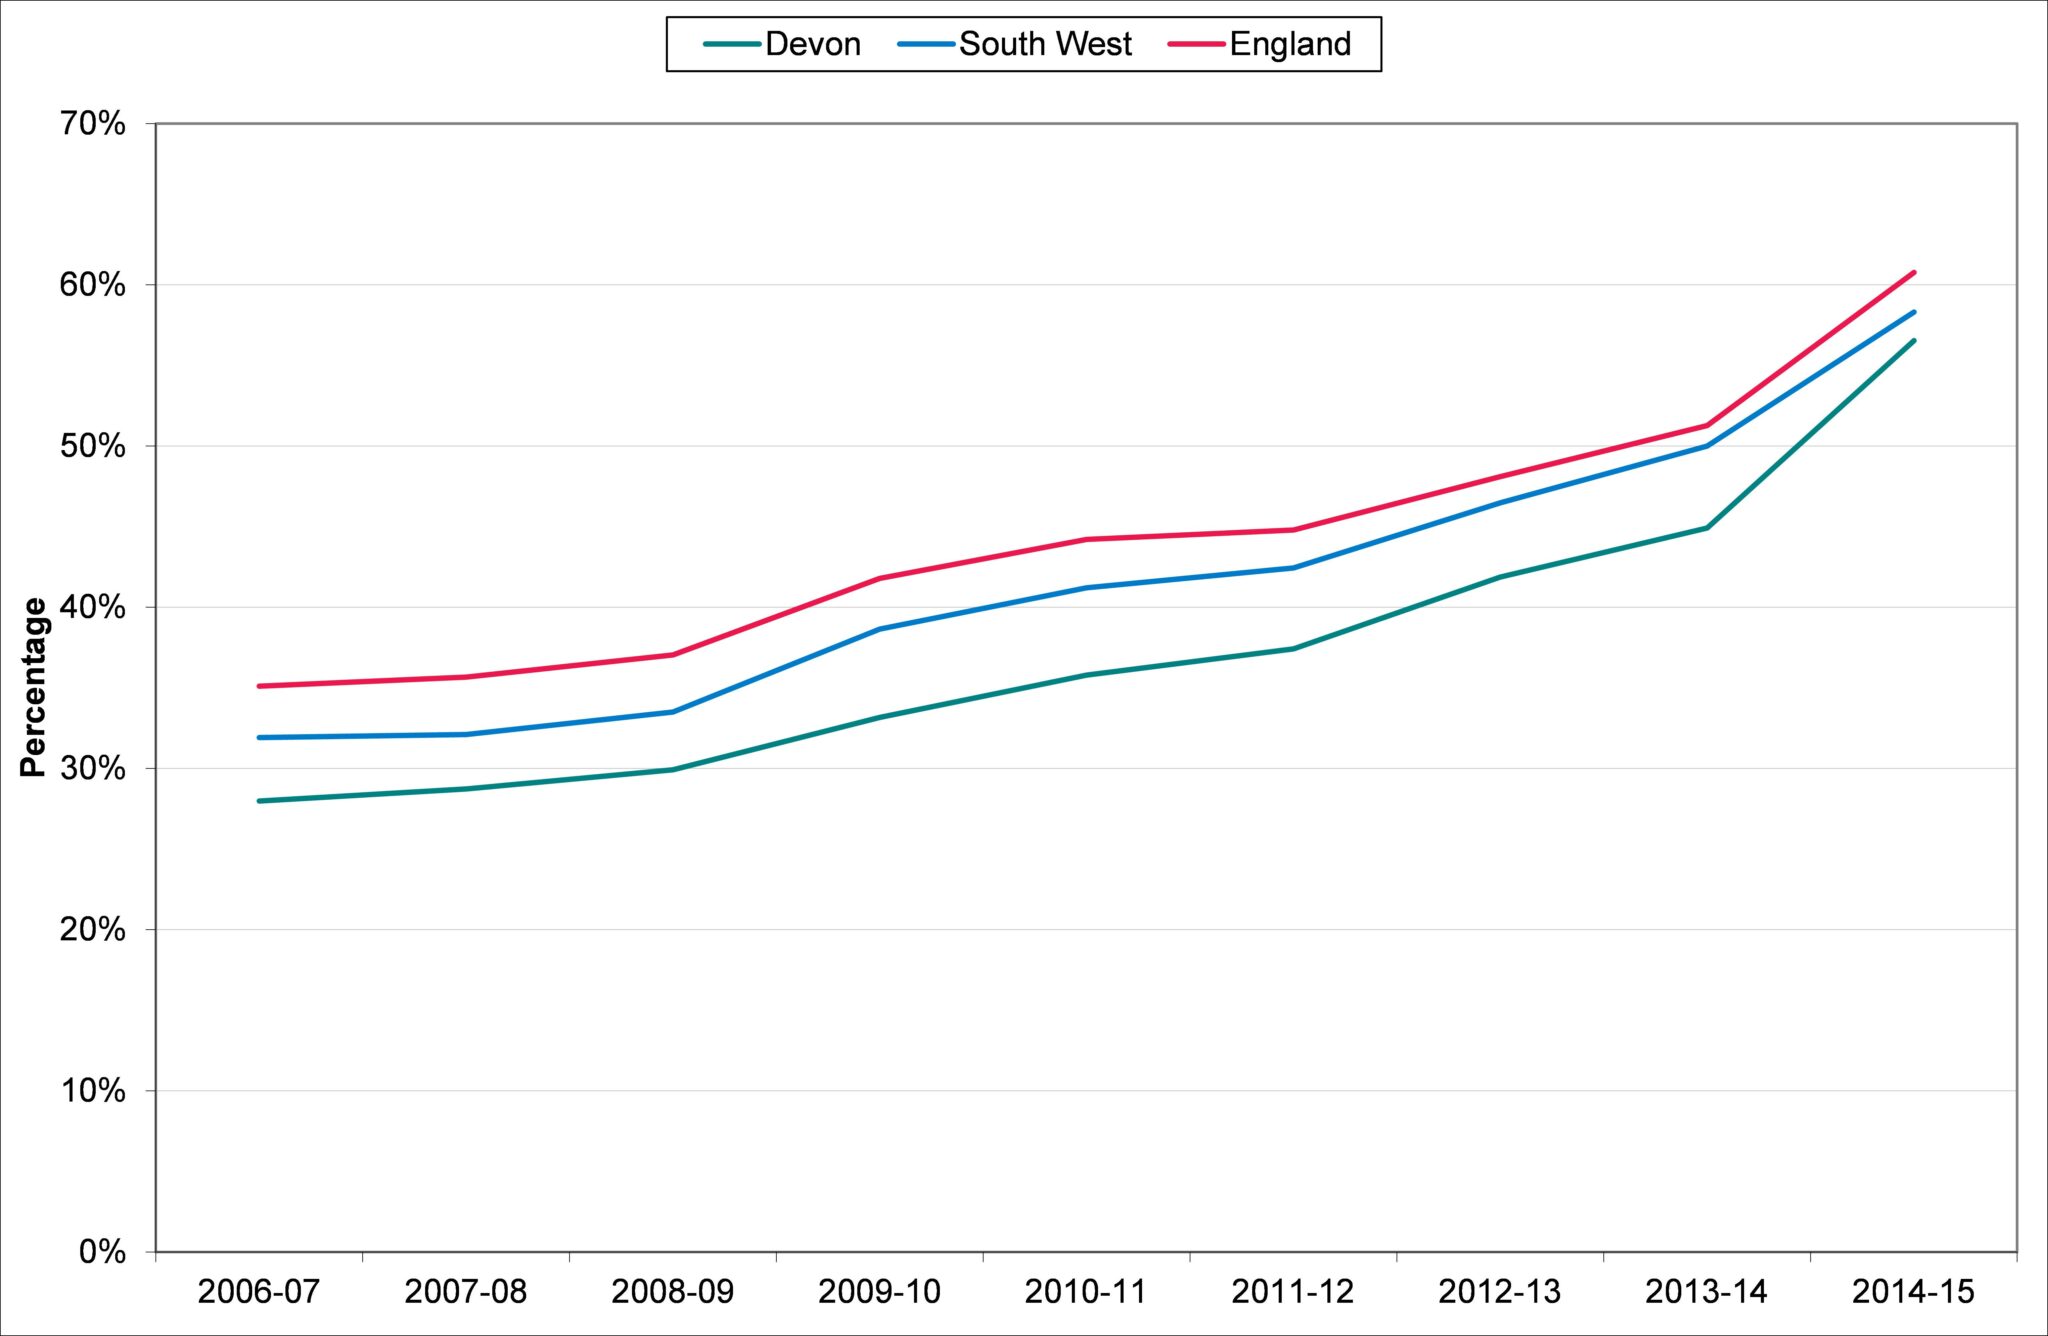
In March 2015, 7,838 people registered with Devon GPs were on a GP register for dementia, compared with an expected prevalence of 13,864, a diagnosis rate of 56.5%. This is in line with Devon’s local authority comparator group (56.5%) as illustrated in figure 10.15, and below the South West (58.3%) and England (60.8%) rates. Figure 10.16 reveals that diagnosis rates have improved in recent years, increasing from 28.0% in 2006-07, narrowing the gap on the rates seen regionally and nationally. At a town level, the highest rates in Devon are seen in Teignmouth (70.0%) and the lowest diagnosis rates are seen in Moretonhampstead (41.6%) and Tiverton (44.7%). There are no significant differences in Devon based on area deprivation.
Figure 10.15, Dementia Diagnosis Rate (% of those expected to have dementia who are on the GP disease register), Devon Local Authority Comparator Group, March 2015
Source: Dementia Prevalence Calculator, Primary Care Data Tool, 2015
Figure 10.16, Trend in the Dementia Diagnosis Rate (% of those expected to have dementia who are on the GP disease register), Devon, South West and England
Source: Dementia Prevalence Calculator, Primary Care Data Tool, 2015