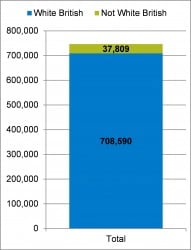
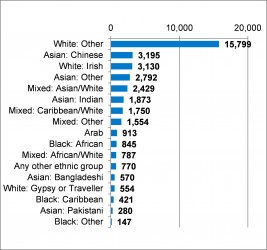
According to the 2011 census the vast majority of people in Devon (94.9%) are from a White British ethnic background, which is higher than the South West (91.8%) and England (79.8%) proportions. Figure 4.2 highlights that around 38,000 in Devon are from a non-White British background. The largest ethnic group is ‘White: Other’, which tends to be European in origin.
Figure 4.2, Devon Population by Ethnicity, 2011


Source: 2011 Census
Health, Care and Wellbeing Needs
All ethnic minority groups in England are more likely to live in deprived neighbourhoods than the White British population, with more than one in three from Bangladeshi and Pakistani ethnic groups living in a deprived neighbourhood. However, this, proportion is decreasing. The unemployment rate of ethnic minorities is more than twice that of the White British population, with disparities greatest for Black ethnic groups.
The White Gypsy or Irish Traveller group has the poorest health, with men and women having rates of long-term limiting illness twice that of the White British group. Persistent health inequalities are also seen in the health of Pakistani and Bangladeshi women with illness rates 10% higher than in White British women. By comparison, the Chinese ethnic group persistently reports better health in both men and women.
The British Heart Foundation report the prevalence of cardiovascular disease does not vary considerably by ethnic group for females, and in men, rates were highest in Irish and White British and lowest in Black African men.
Black Caribbean, Indian, Bangladeshi and Pakistani men have a considerably higher prevalence of diabetes than the overall population.
Cancer research UK report higher mortality rates in White British groups, although survival rates for breast cancer are lower in Asian and Black ethnic groups.
Risk factors also vary across different ethnic groups. Smoking is most prevalent in Bangladeshi men, and binge drinking is much lower across ethnic minority groups. Individuals from different ethnic groups store fat in different places of the body resulting in different body shapes. Obesity, as measured by BMI, is much lower in South Asian groups and Chinese men than the overall population. Breastfeeding rates tend to be higher in black and minority ethnic groups.
Further Information
- Plymouth and Devon Racial Equality Council http://plymouthanddevonrec.org.uk/
- The Dynamics of Diversity: evidence from the 2011 Census available at http://www.ethnicity.ac.uk/research/outputs/briefings/dynamics-of-diversity/
- East Midlands Public Health Observatory available at http://webarchive.nationalarchives.gov.uk/20160105090842/http://www.empho.org.uk/themes/ethnicity/inequalities.aspx
- Fair Society Healthy Lives (The Marmot Review) available at http://www.instituteofhealthequity.org/projects/fair-society-healthy-lives-the-marmot-review