Socio-economic status and social class are directly related to health status: the better-off are healthier. Income is probably the most important factor, as it is associated with improved diet, living conditions and housing, and is related to educational achievement.
When we analyse health trends by different condition, we see variation in the difference, so that for drug- and alcohol-related health behaviour and outcomes (Figure 5.01) the difference is stark; for other conditions such as cancer (Figure 5.02) it is less so.
Figure 5.01: Alcohol-related deaths by Index of Multiple Deprivation quintile, Direct Age Standardised Rate per 100,000 population, 2001-2003 to 2011-13.
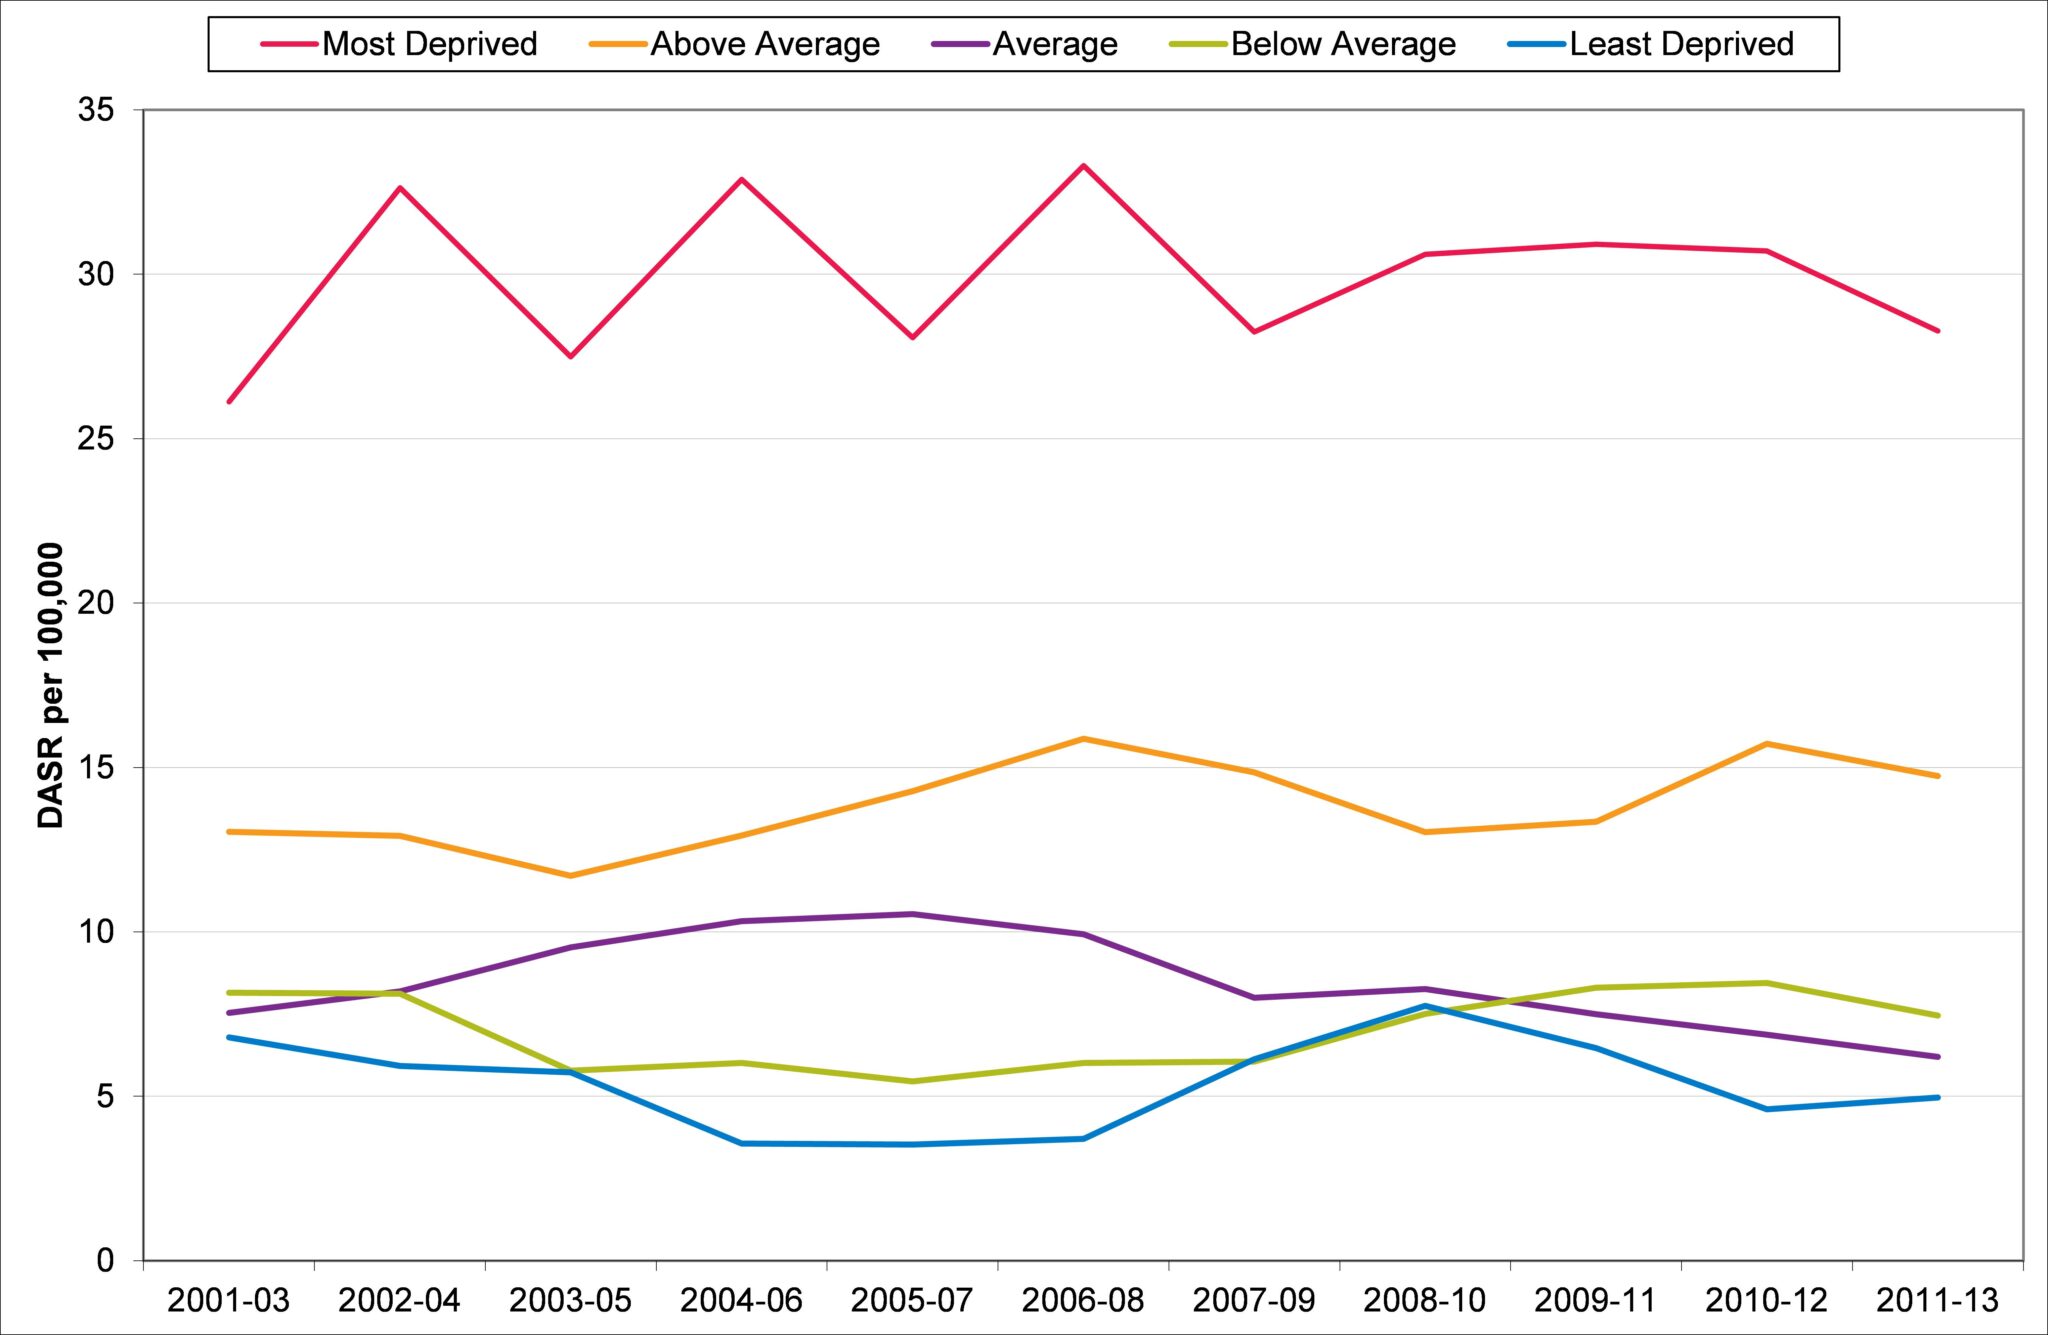
Source: Primary Care Mortality Dataset 2014
Figure 5.02: Deaths from All Cancers by Index of Multiple Deprivation quintile, Direct Age Standardised Rate per 100,000 population, 2001-2003 to 2011-13.
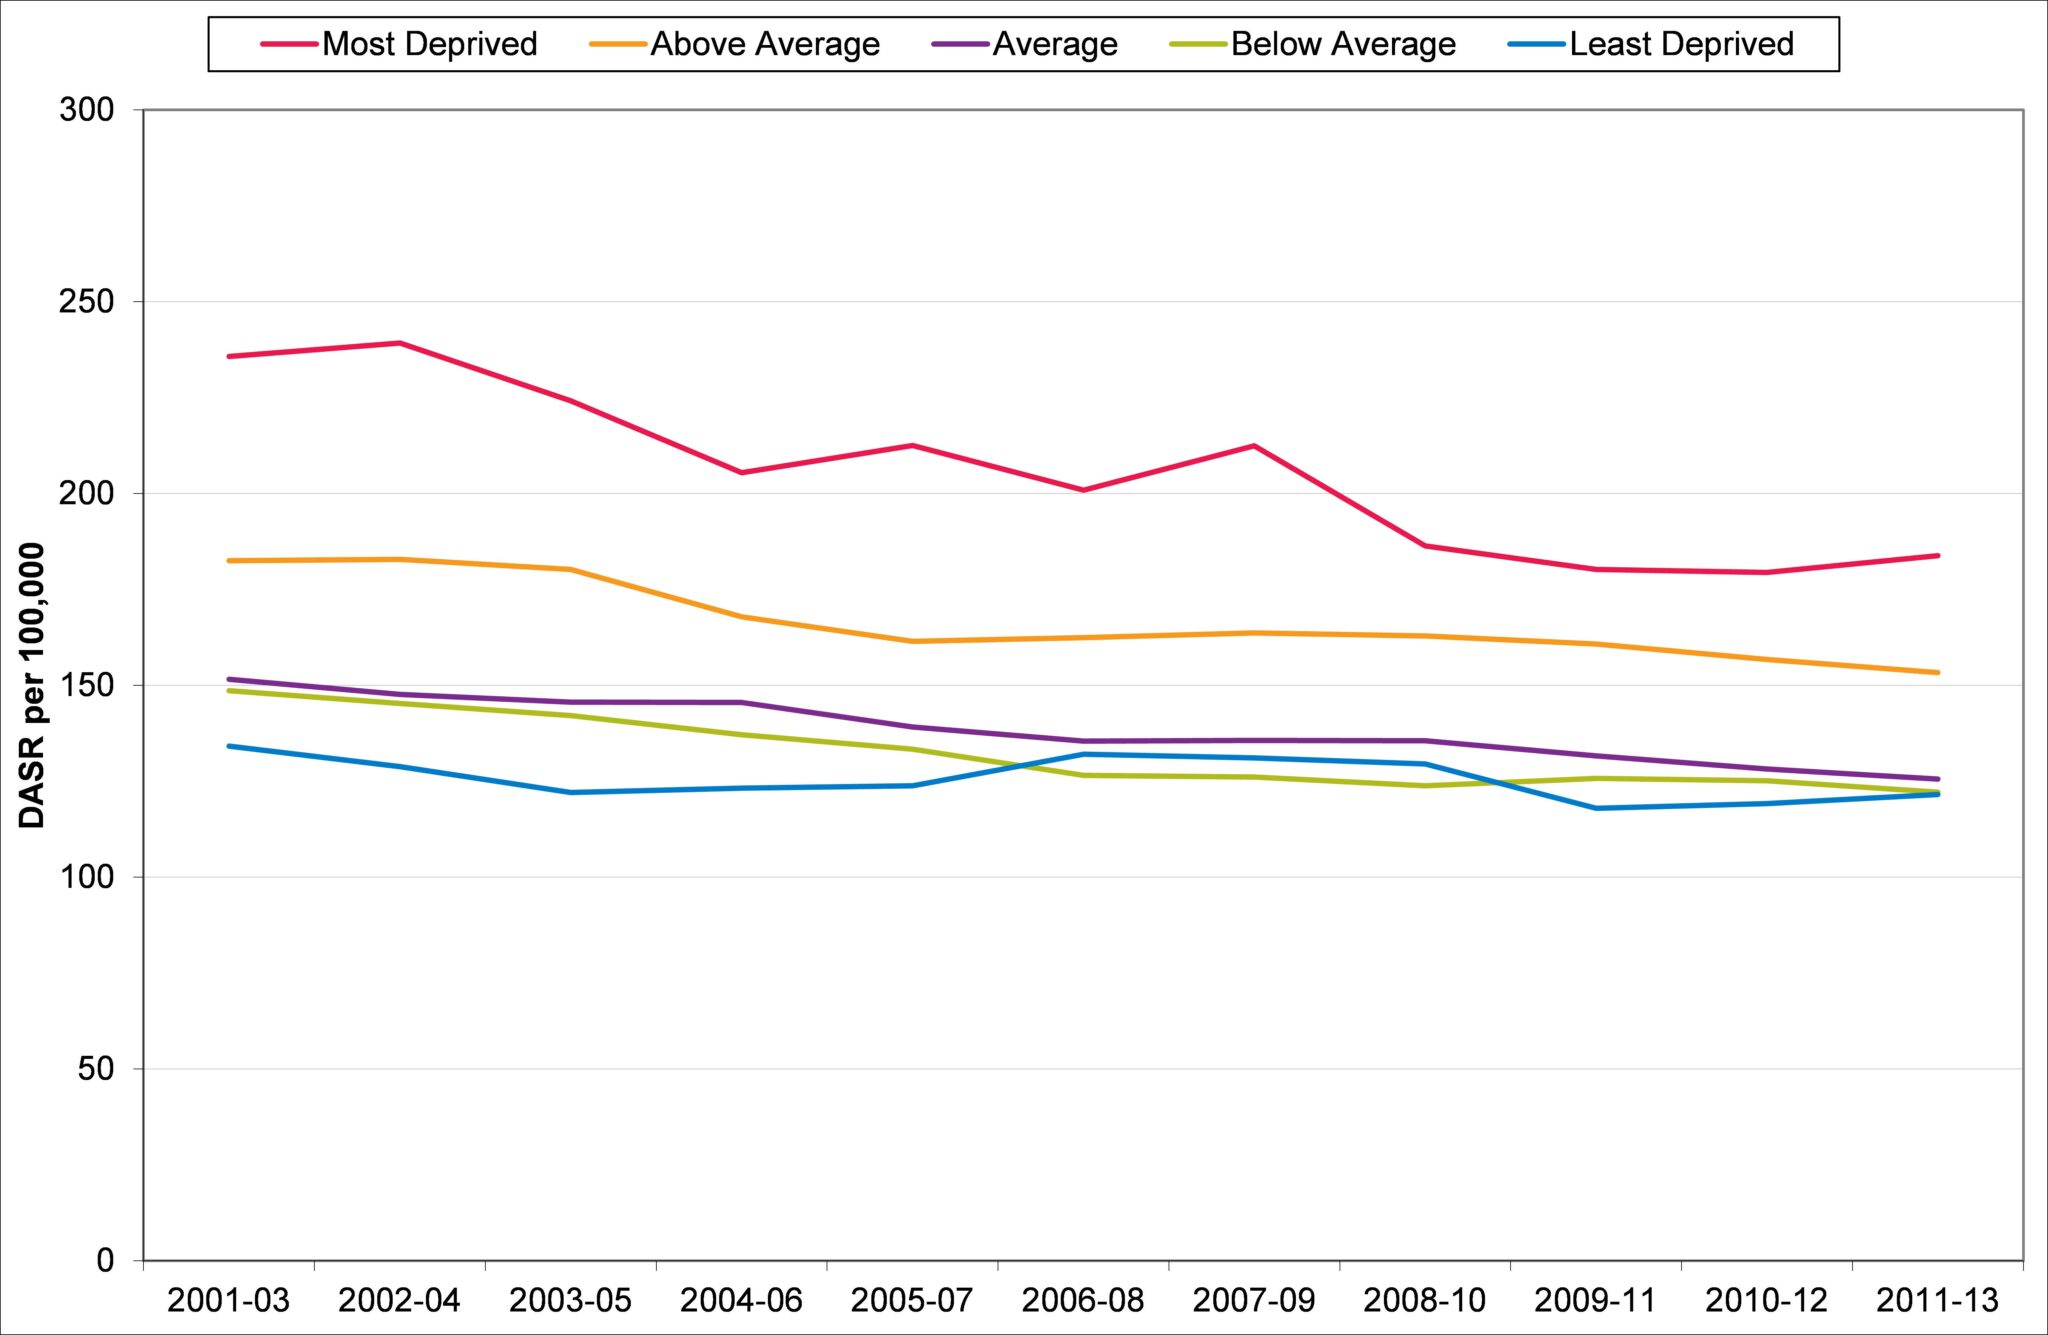
Source: Primary Care Mortality Dataset 2014
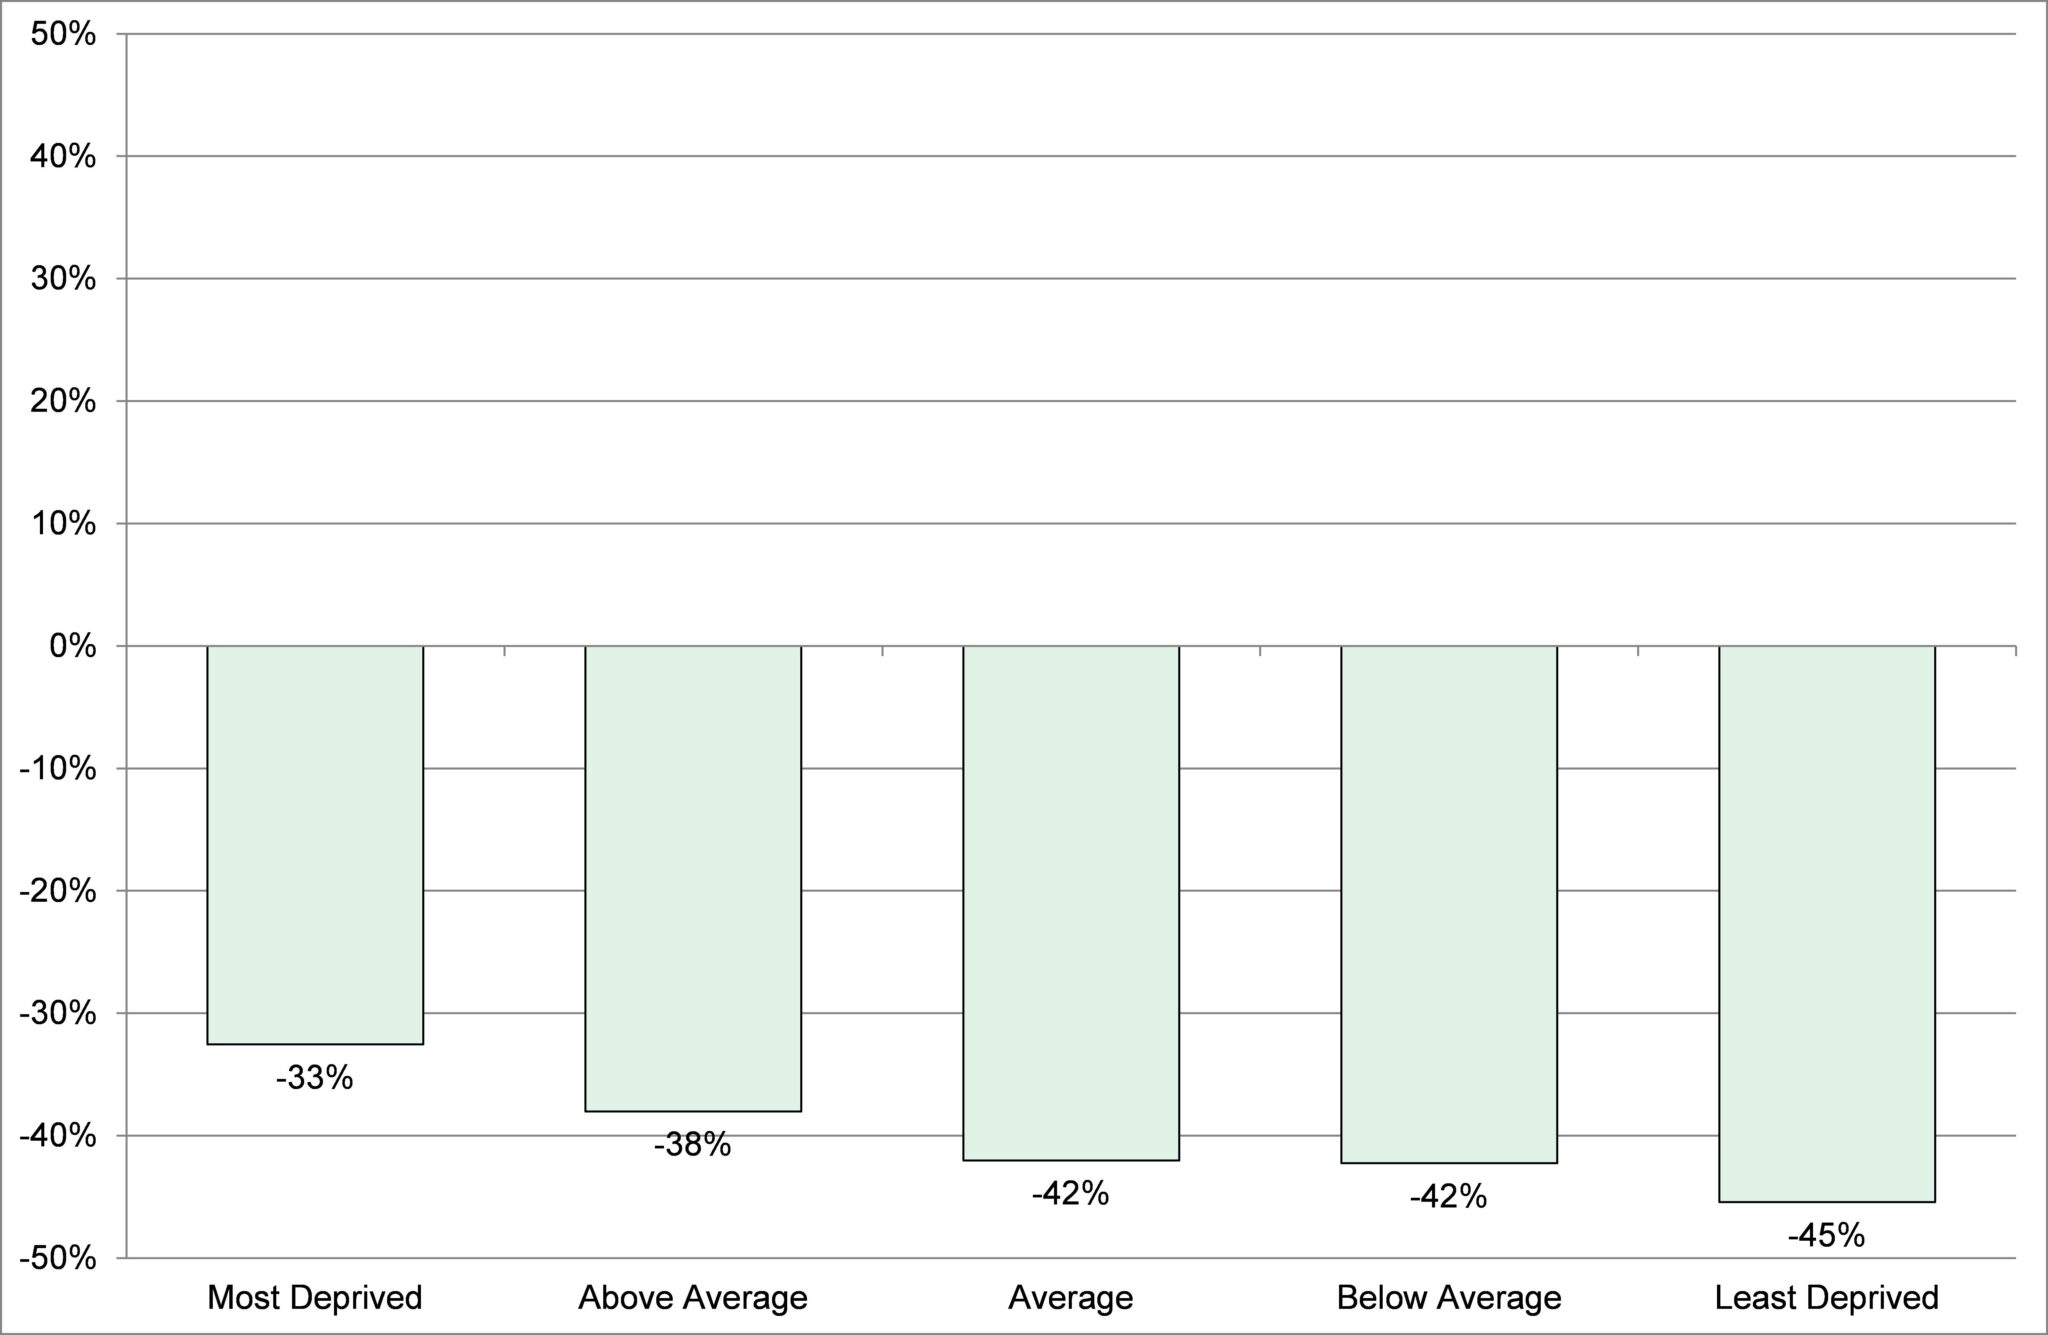
The gap between the best-off and the worst-off had been reducing in Devon, although recent trends (since about 2010) suggest that while the better-off in Devon have the lowest all-age all-cause mortality rates, the worst-off have seen a relative increase in mortality rates (Figures 5.03). When the change in mortality rates for this period are considered overall, although the reduction in the most deprived is the lowest (when it should be the greatest), there can be seen a trend in the right direction with the least deprived cohort’s rate of change being the least (Figure 5.04) – allowing those in the middle groups to “catch up”. The challenge here is to do more to improve the health of the worst-off in Devon. Although in number they represent the smallest of the five socio-economic groupings, their health is significantly poorer.
In my Annual Report of 2012-13 – on progress made during the six years of the Devon Primary Care Trust (NHS Devon) – I highlighted the importance of monitoring the impact of health care systems on health inequality. At the time of that report there were some encouraging signs of reduction in health inequality shown by the trends in mortality from conditions considered amenable to health care intervention.
The NHS has a legal duty to reduce health inequality but Figures 5.05 shows that there has been little overall change. Figure 5.06 shows that over the last 10 years, the greatest improvement in mortality has been in the best-off, and the gradient is the wrong way round to close the health inequality gap.
Figure 5.03: All age, all-cause mortality rates by Index of Multiple Deprivation (IMD) quintile, Devon, 2001-03 to 2011-13.
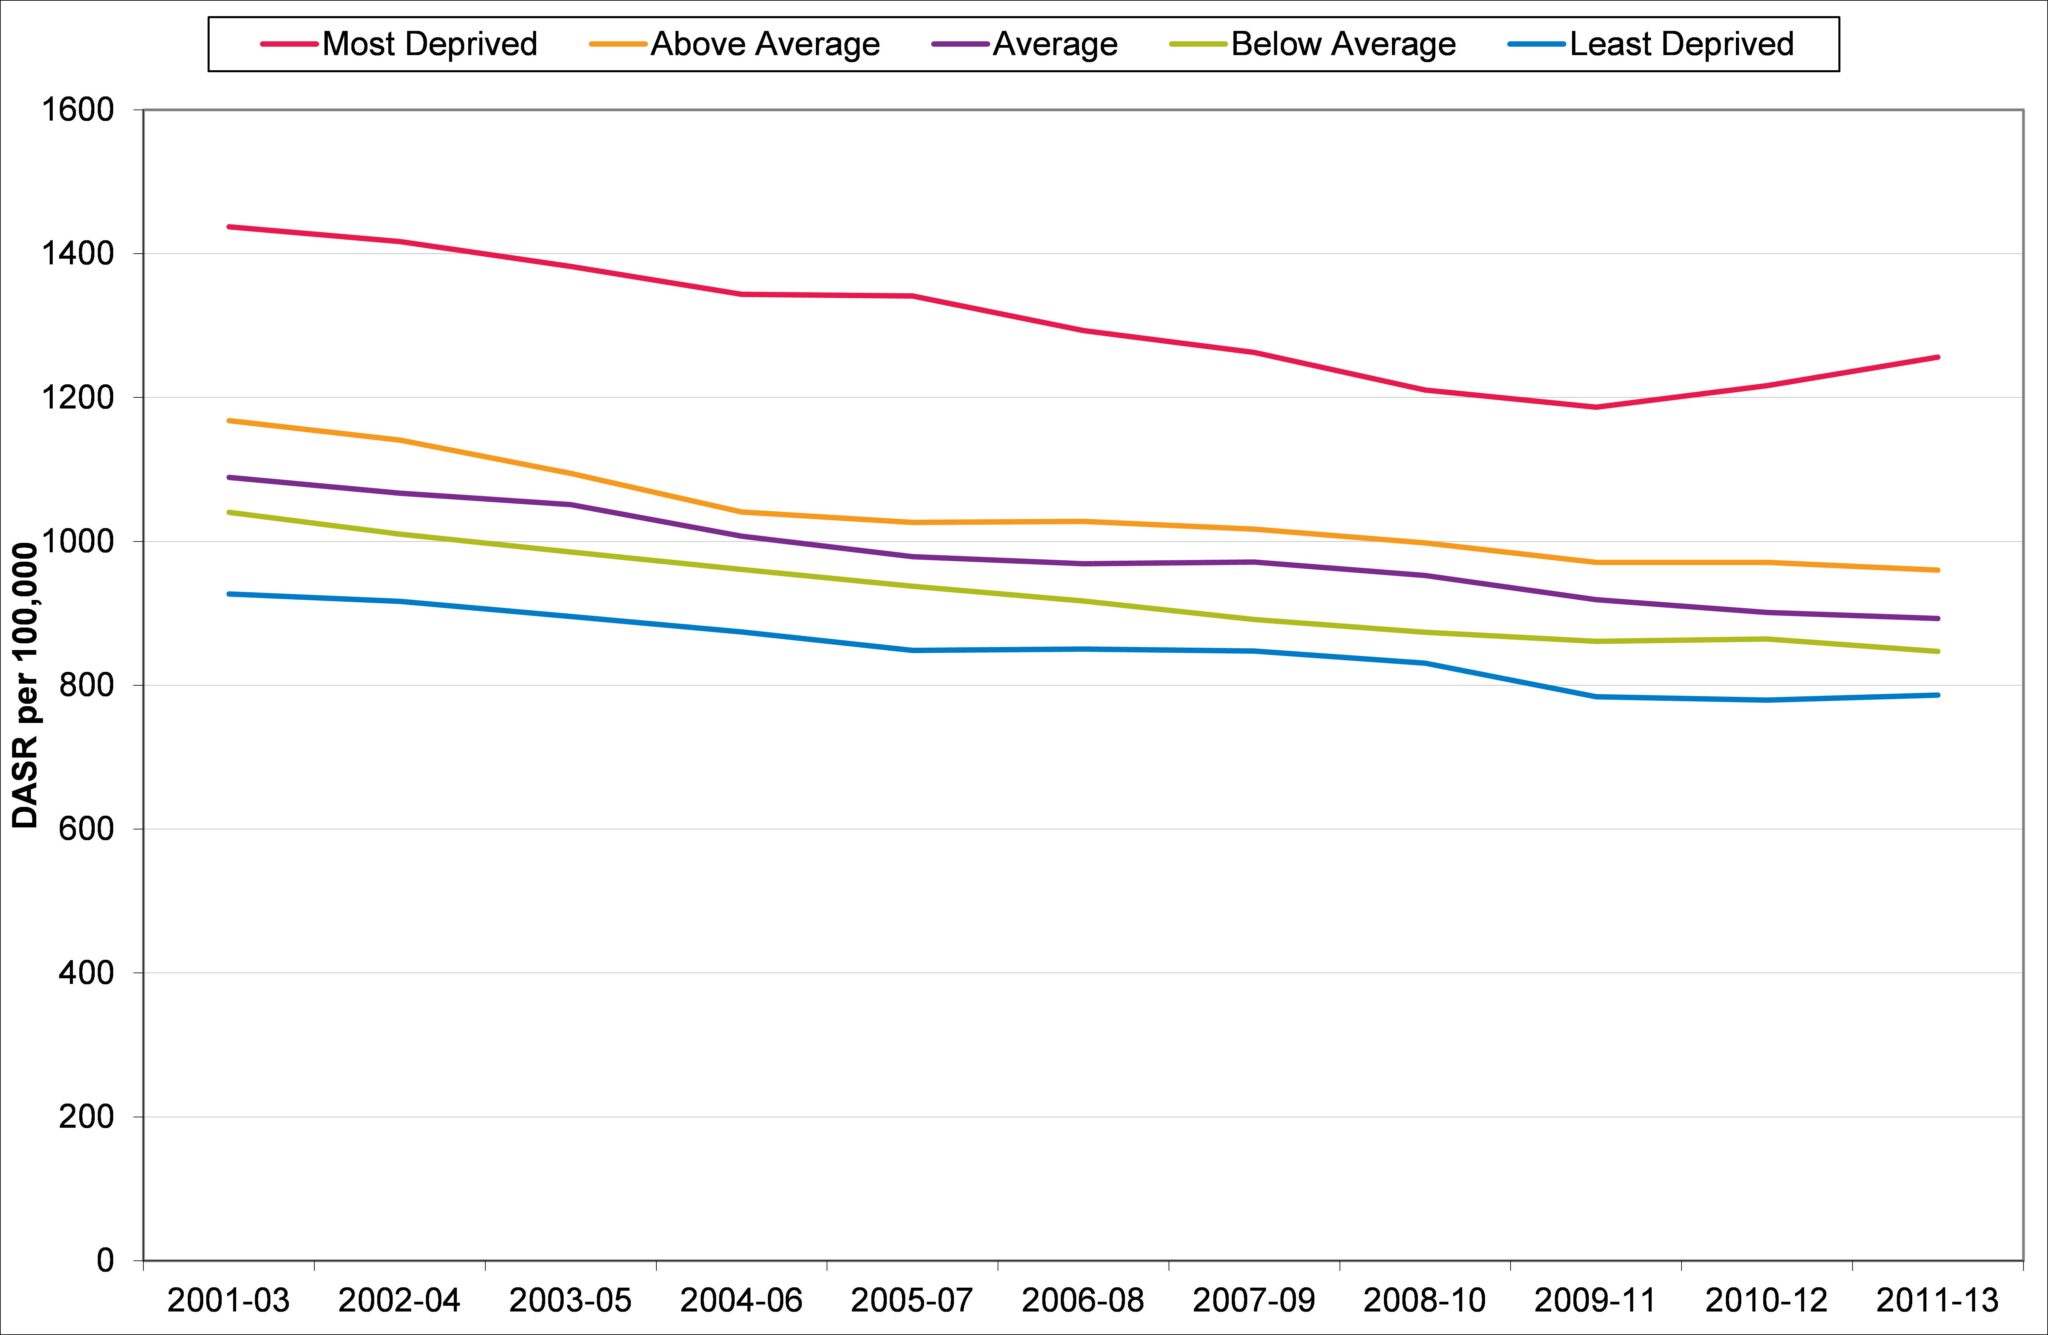
Source: Primary Care Mortality Dataset 2014
Figure 5.04: Percentage change in all age, all-cause mortality rates by Index of multiple Deprivation quintile, Devon, 2001-03 to 2011-13.
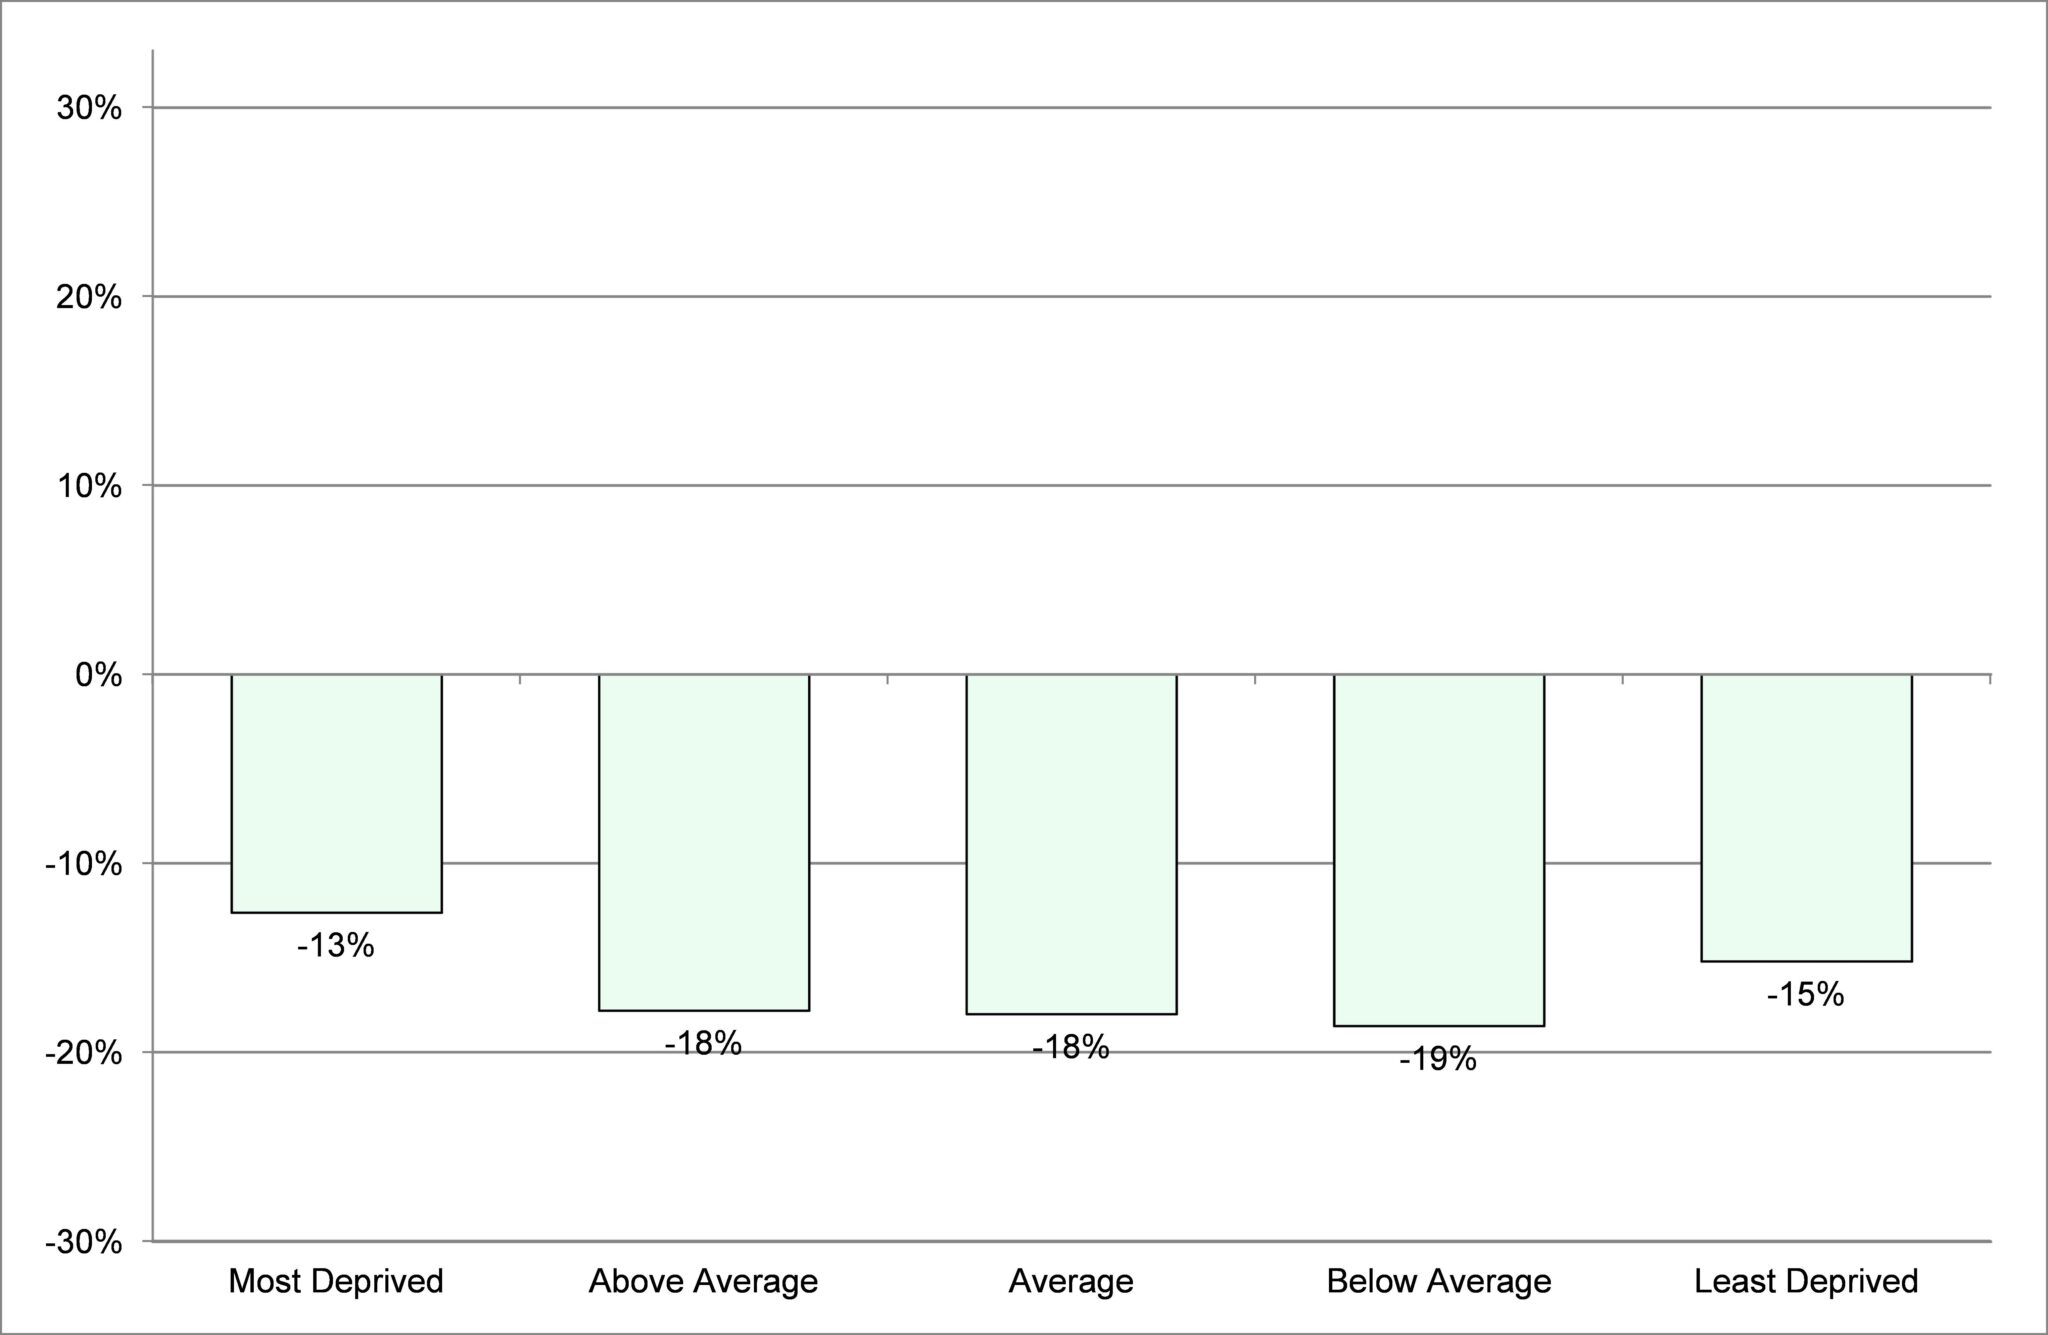
Source: Primary Care Mortality Dataset 2014
Figure 5.05: Mortality rates from conditions considered amenable to healthcare by Index of Multiple Deprivation quintile, Devon, 2001-03 to 2011-13.

Source: Primary Care Mortality Dataset 2014
Figure 5.06: Percentage change in mortality rates from conditions considered amenable to healthcare by Index of Multiple Deprivation quintile, Devon, 2001-03 to 2011-13.
Source: Primary Care Mortality Dataset 2014
Increasing prosperity of a local area will necessarily have an impact on health and wellbeing and included within this is increasing people’s financial independence at all ages through employment and full access to benefits to which people are entitled.
One particularly sensitive indicator of deprivation is oral health, which is affected by diet and health behaviour – good quality teeth cleaning and the use of fluoride toothpaste. The results of the dental health survey of children show considerable differences by socio-economic deprivation although generally dental health has improved[http://www.hscic.gov.uk/article/2021/Website-Search?productid=17584&q=Dental+Health+Survey+of+Children+and+Young+People
+2015&sort=Relevance&size=10&page=1&area=both#top]. Comparison with local authority neighbours shows that while Devon is better than the England average, it is average for its comparator group and so could improve (Figure 5.07).
Figure 5.07: Oral Health in Children aged 5, mean number of decayed, missing or filled teeth (dmft) per child, 2011/12, by local authority comparator group.

Source: Public Health Outcomes Framework, 2015
Source: Public Health Outcomes Framework, 2015Equally, teenage pregnancy is an example of an indicator where high rates are associated with socio-economic deprivation and disadvantage. Over the past eight years, following the publication of the teenage pregnancy strategy, there has been combined work by schools, primary care and sexual health services to reduce unwanted teenage pregnancy. While rates have decreased nationally, Devon now has its lowest rate since 1998. What is particularly striking is the narrowing of the inequality gap (Figure 5.08).
Figure 5.08: Teenage Conception Rate per 1,000 population in highest ranked wards for socio-economic deprivation in Devon, 2007-09 to 2010-12.
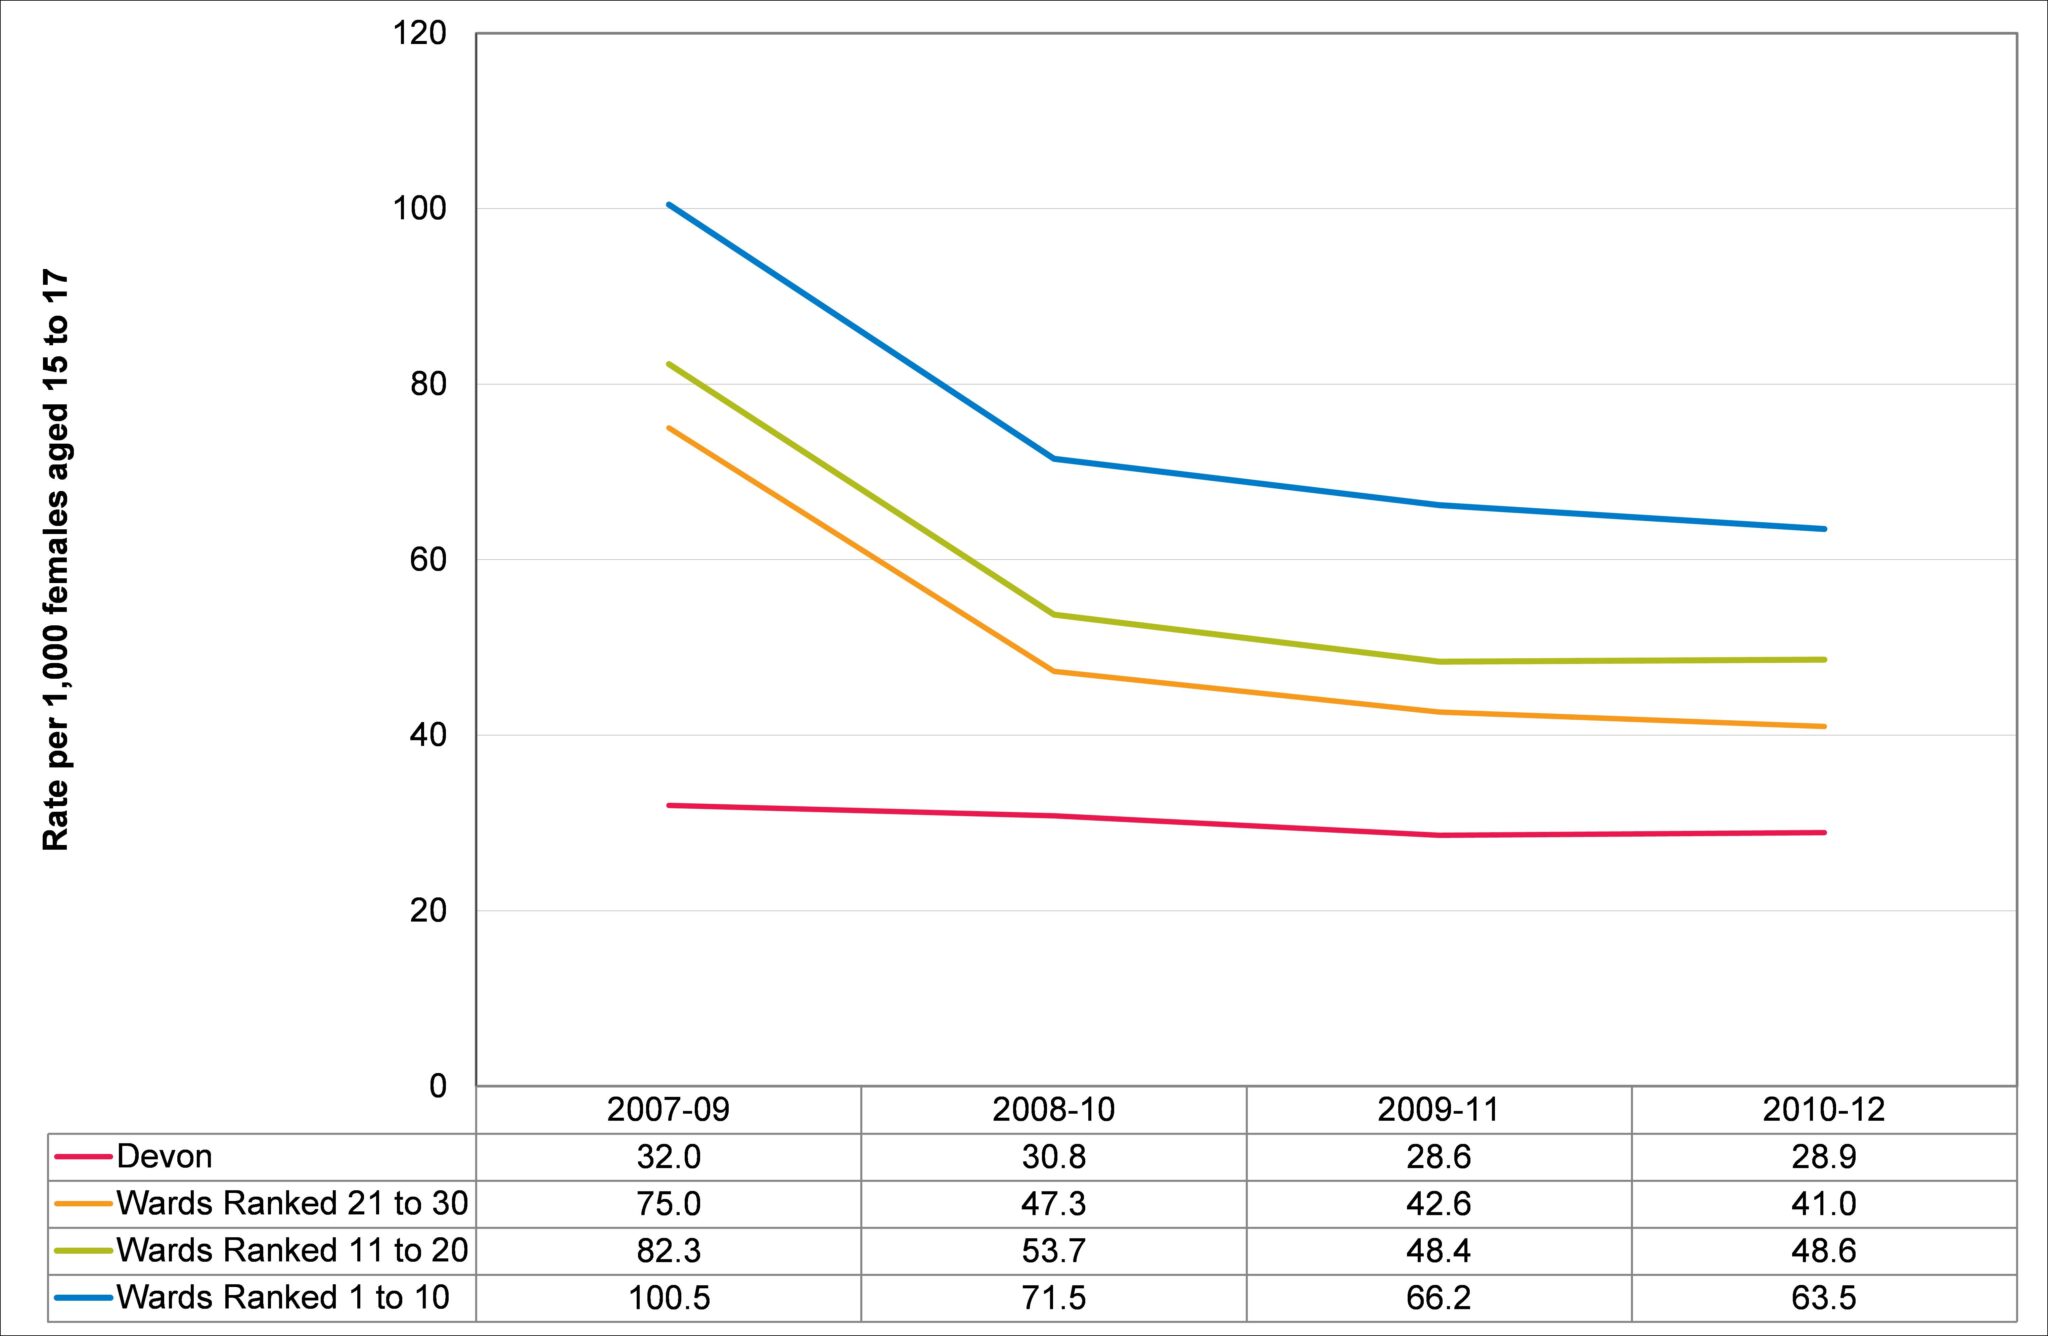
Source: Office for National Statistics, 2014