The first Annual Public Health Report for Devon, published in 2008, showed how much variation there was in life expectancy across the county of Devon[http://www.devonhealthandwellbeing.org.uk/aphr/2007-08/]. Following this 2008 report, Public Health Senior Intelligence Analyst Kirsty Priestley undertook an equity audit, which was published in 2011, to explore why the Ilfracombe population had the shortest life expectancy in Devon[http://marksandbox3.reworkdigital.info/health/wp-content/uploads/2011/07/Life-Expectancy-in-Ilfracombe-Health-Equity-Profile-2008.pdf]. Significantly higher death rates from cardiovascular diseases and cancers were associated with lower levels of preventive activity such as the prescription of specific drug treatments. We know that this pattern is a manifestation of the “inverse care law” as described in chapter 3. The Devon community responded to the inequality in several ways, with Devon County Council, North Devon District Council and Ilfracombe Town Council working together to improve local determinants of health such as housing and Devon Primary Care Trust working with local NHS and Health Improvement services funded by Public Health to improve health and health care interventions. The community was chosen as a prestigious national pilot for community budgets, and One Ilfracombe has delivered some impressive improvements by harnessing community capacity for public good. It is therefore timely to look at what has happened to the pattern of health in Ilfracombe over this time period. Have we managed to narrow the health inequality gap?
Ilfracombe Central ward still has the shortest life expectancy in Devon. At 74.6 years it is 15 years less than the place with the longest life expectancy in Devon (Newton Poppleford and Harpford at 89.6 years). Figure 6.08 shows the trend in life expectancy. Compared with the upward trend in both Devon and North Devon’s life expectancy, Ilfracombe Central has shown minimal change, and of some concern is the recent pattern in Ilfracombe East and West with decreases in life expectancy rather than increases.
Death rates from circulatory disease show a particularly striking pattern in Ilfracombe West, with an upward trend rather than a downward one over the last seven-year period (Figure 6.09).
Figure 6.08: Average life expectancy by Ilfracombe ward compared with North Devon and Devon, 2002-06 to 2009-13.
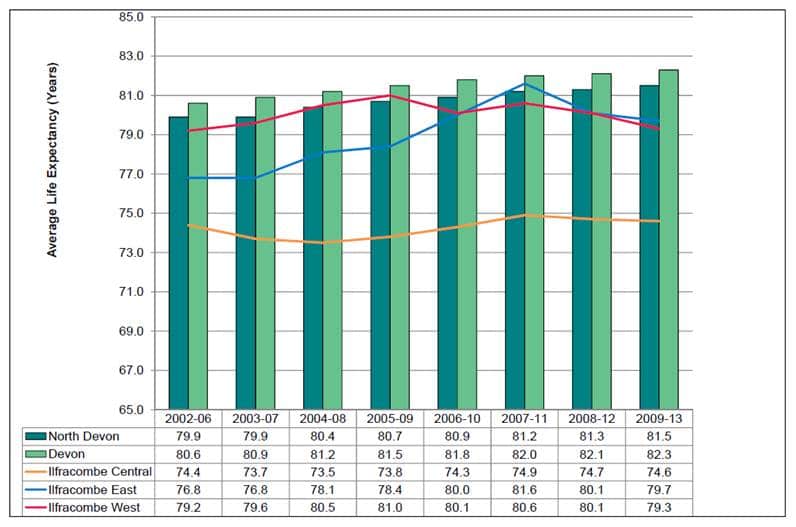
Source: Primary Care Mortality Dataset, 2015
Figure 6.09: Circulatory disease mortality by Ilfracombe ward compared with North Devon and Devon, 2002-06 to 2009-13.
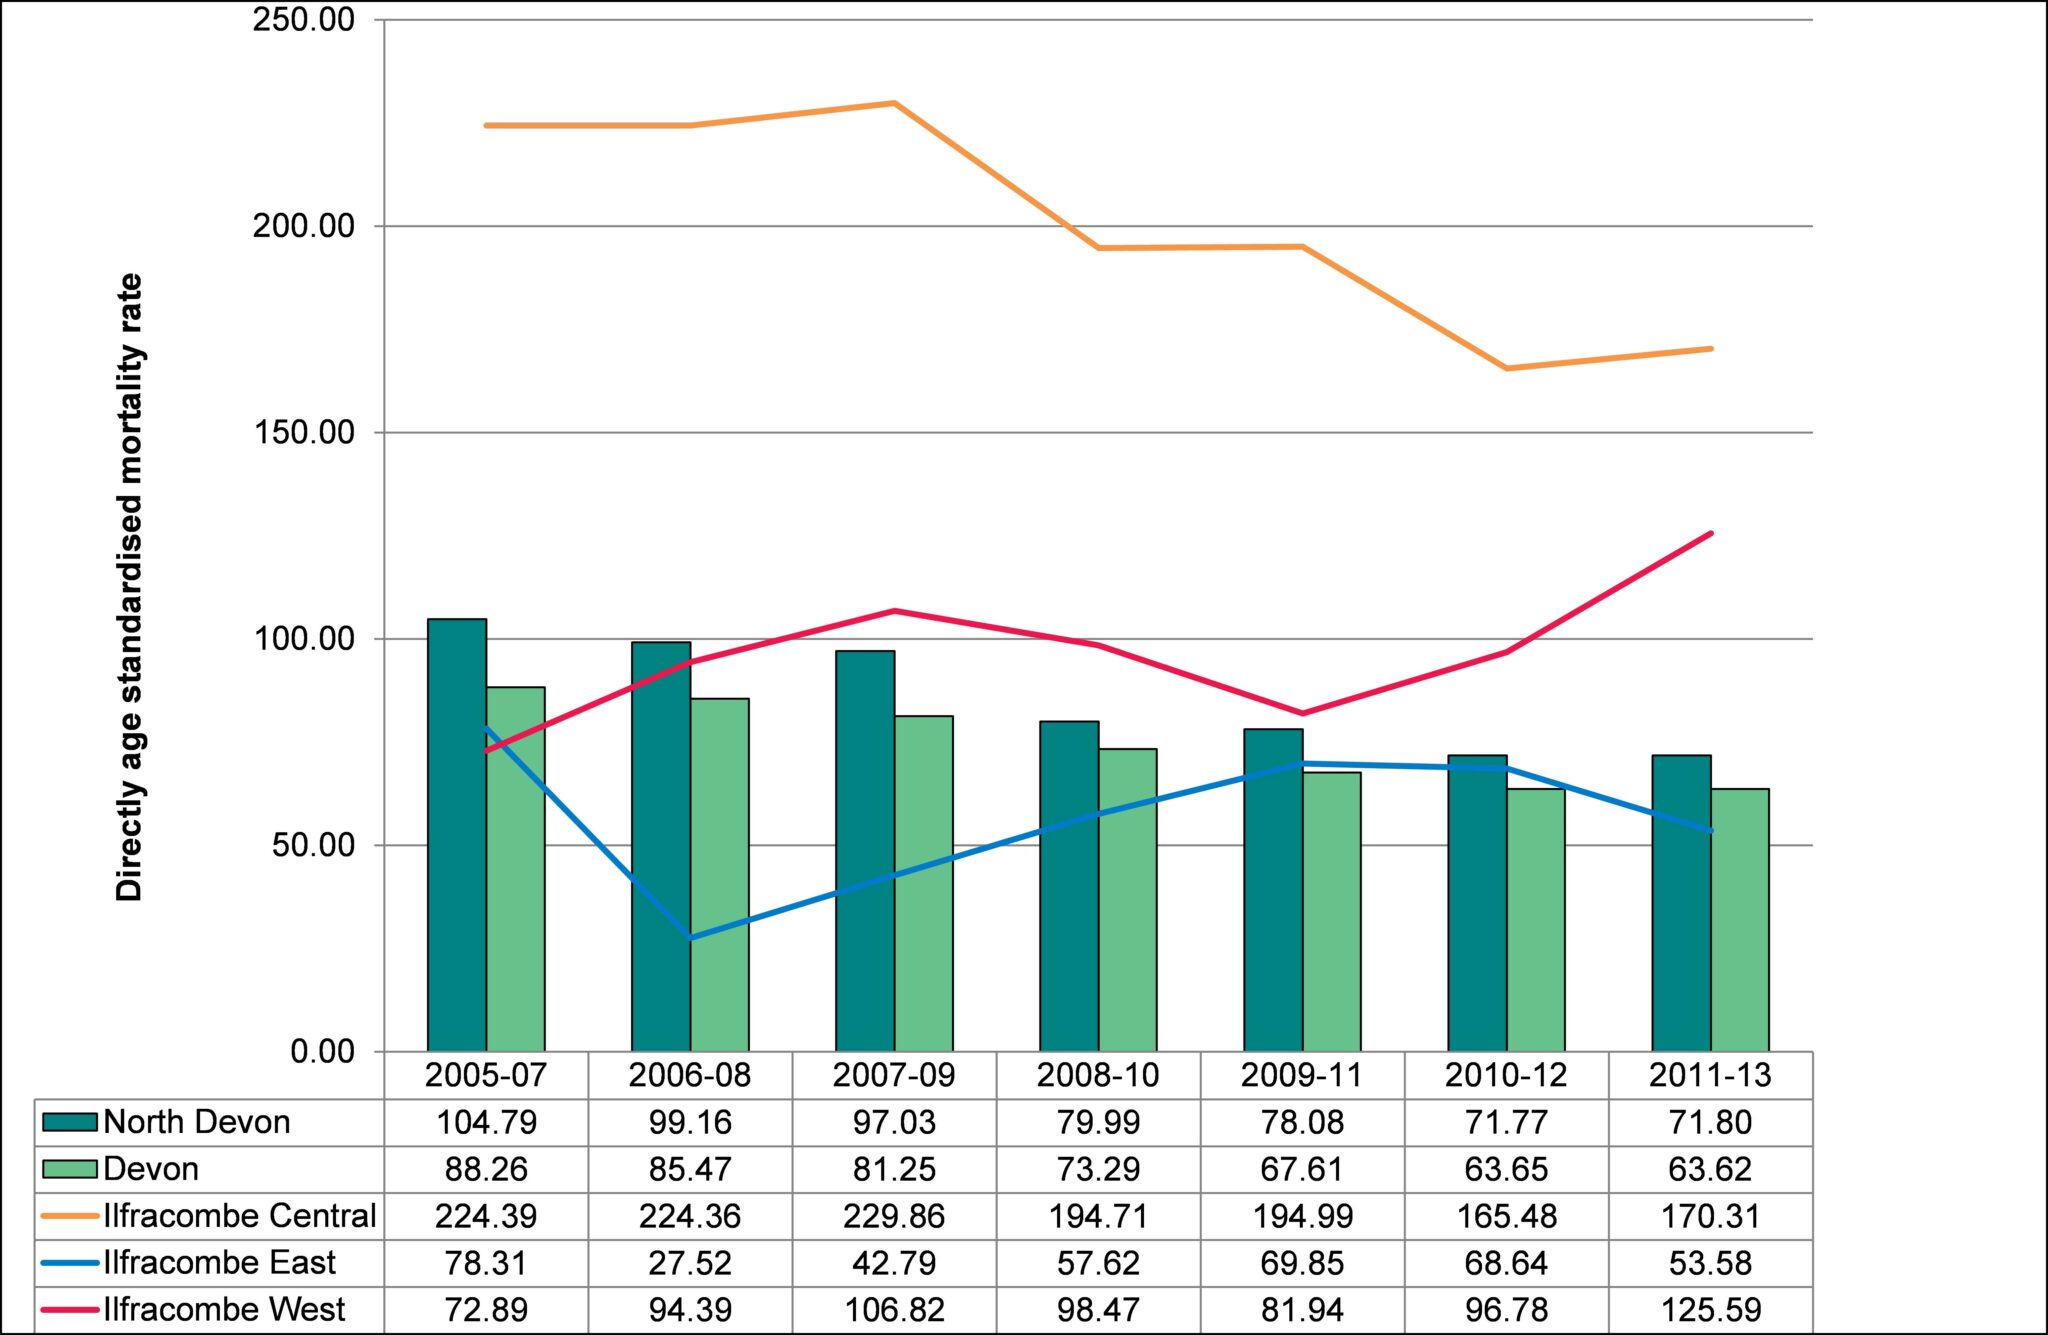
Source: Primary Care Mortality Dataset, 2015
Figure 6.10: Cancer mortality by Ilfracombe ward compared with North Devon and Devon, 2002-06 to 2009-13.

Source: Primary Care Mortality Dataset, 2015
Figure 6.11: Respiratory disease mortality by Ilfracombe ward compared with North Devon and Devon, 2002-06 to 2009-13.
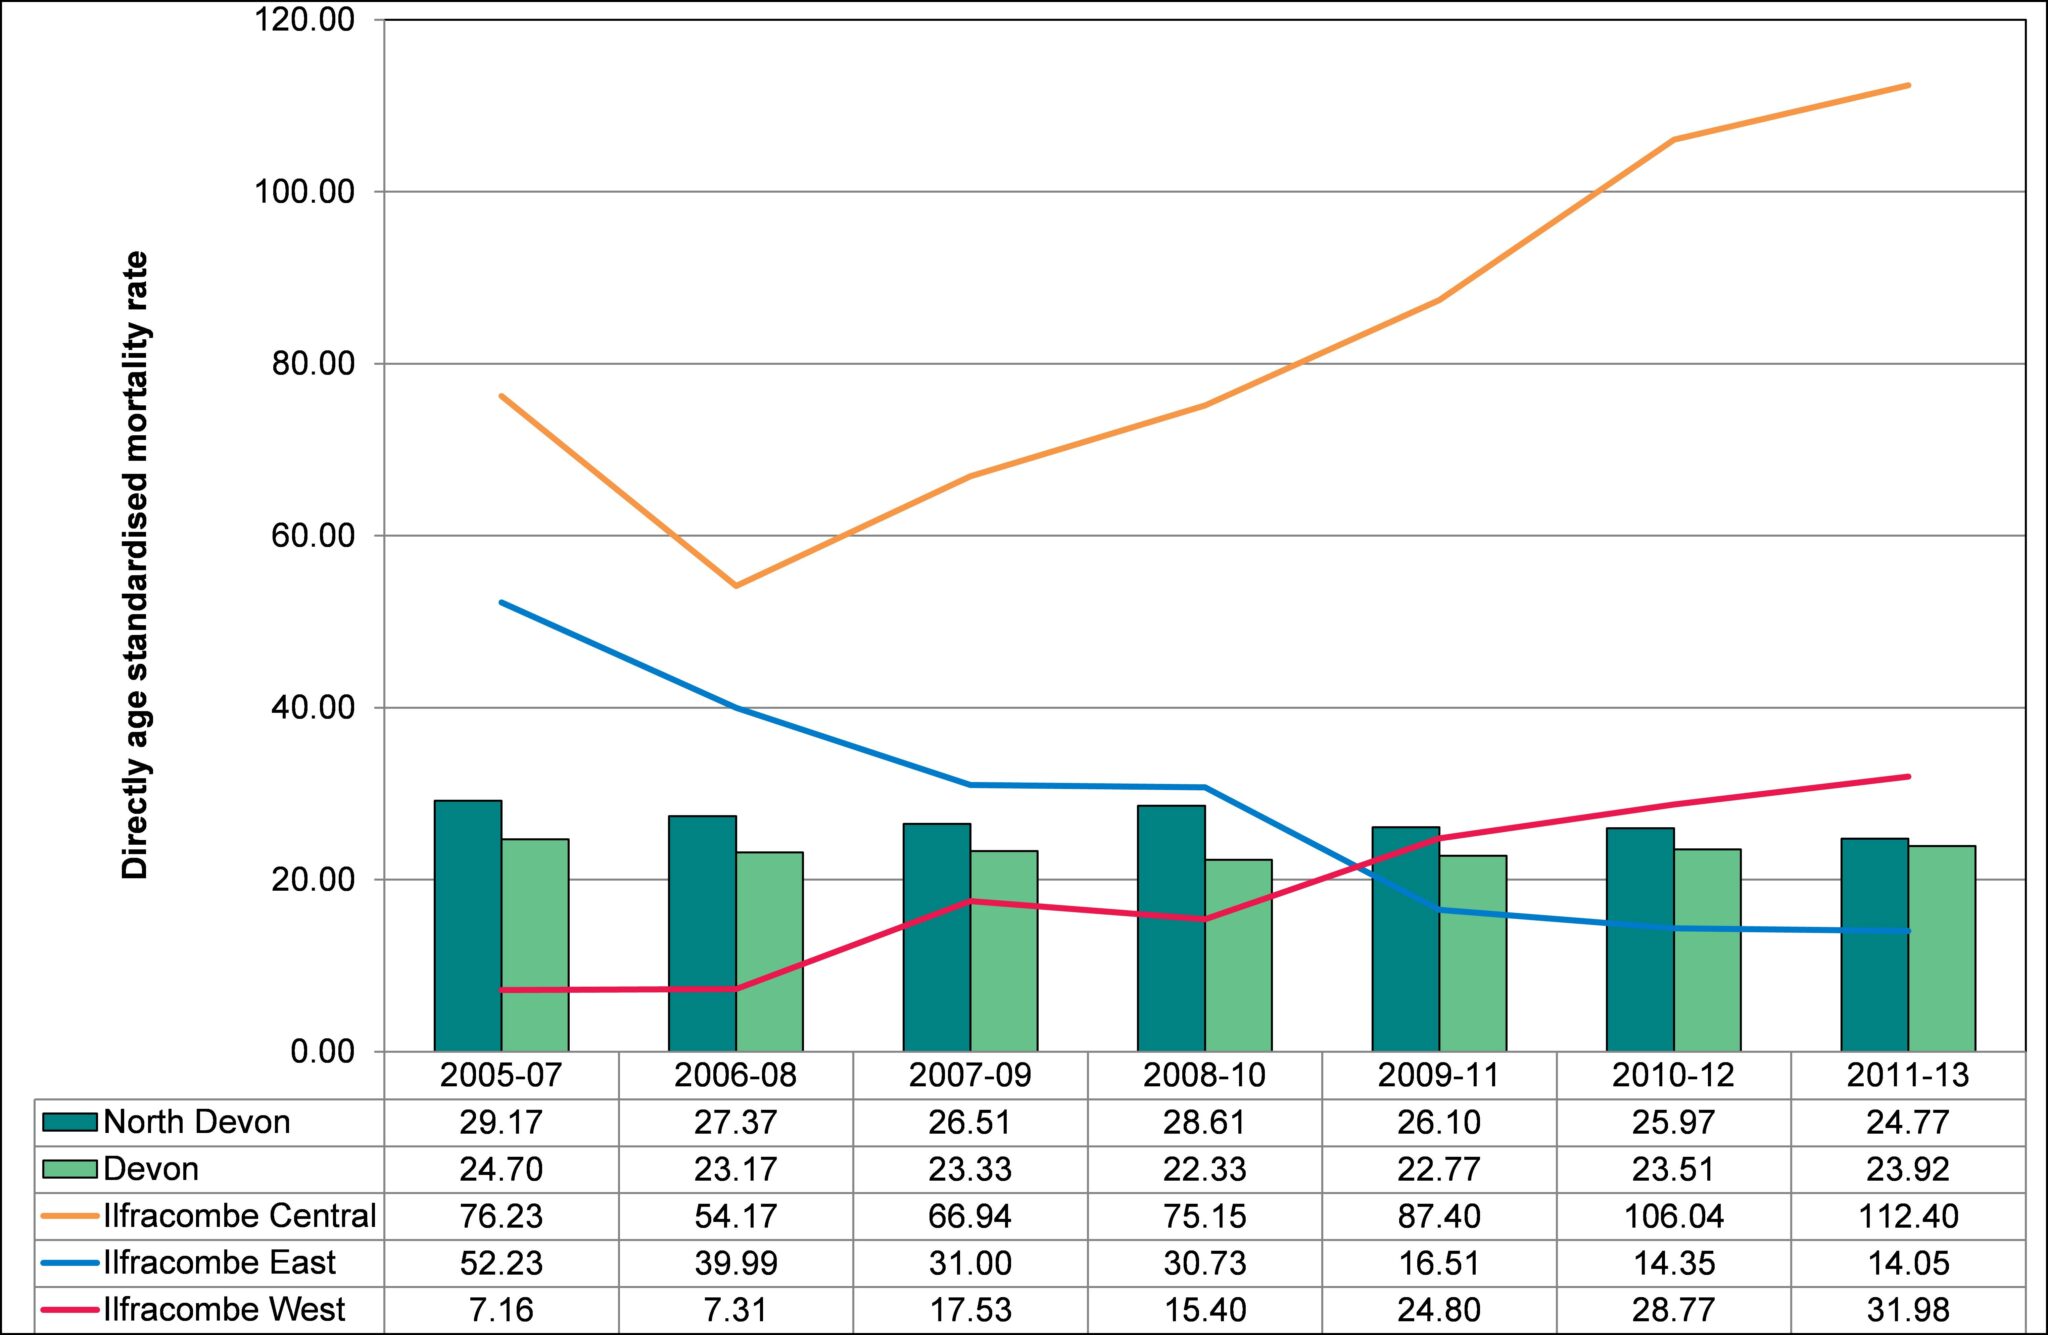
Source: Primary Care Mortality Dataset, 2015
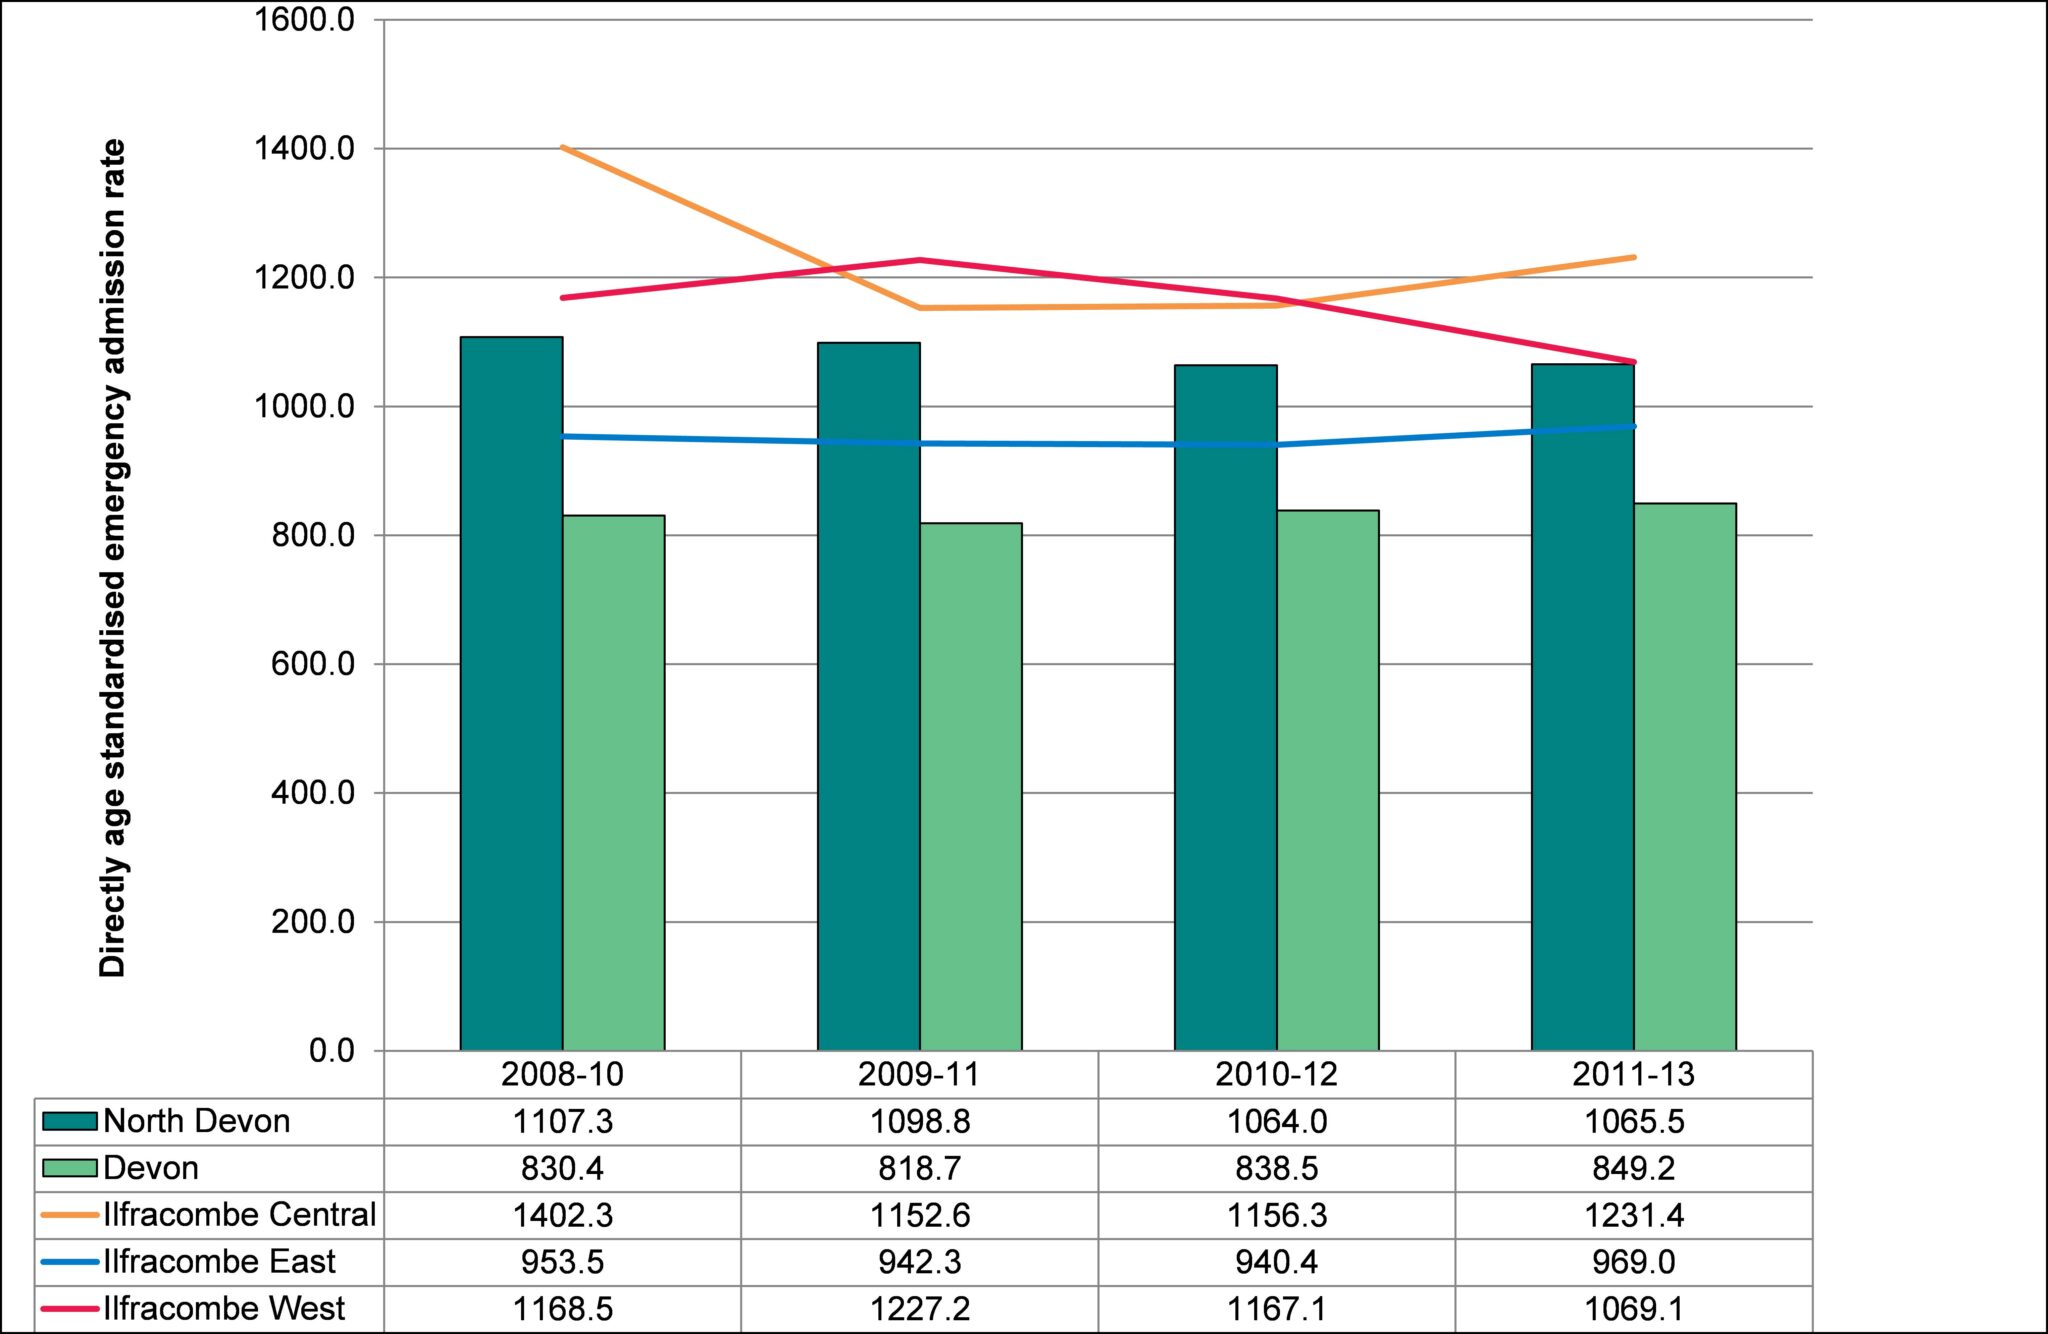
Figure 6.12: Emergency admissions by Ilfracombe ward compared with North Devon and Devon, Direct Age-Standardised Rate per 1000,000, 2008-10 to 2011-13.
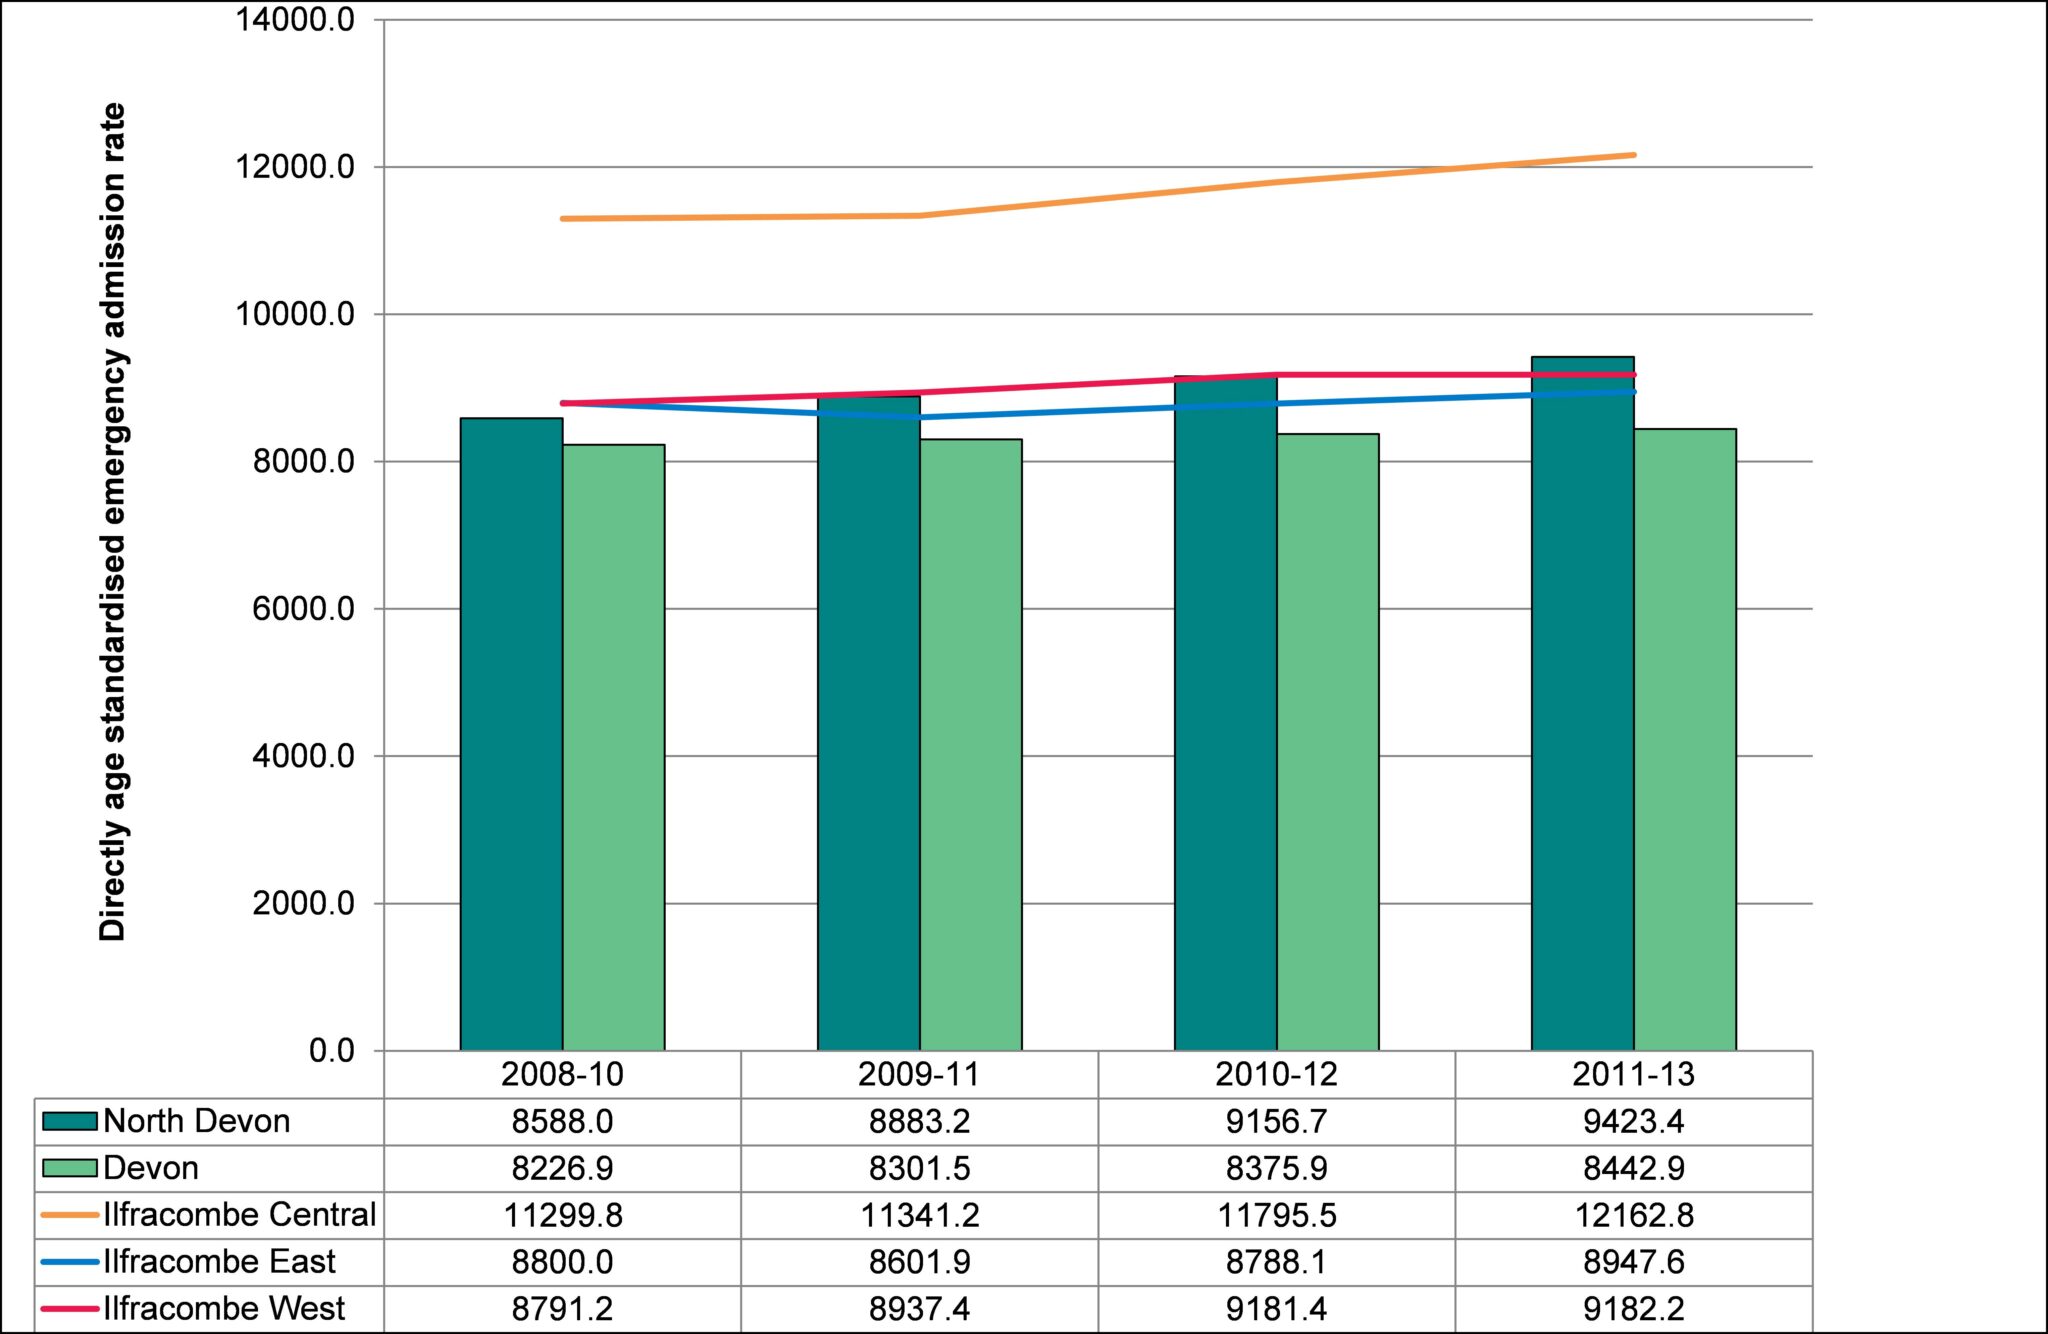
Source: Secondary Uses Services, Inpatient Dataset, 2014
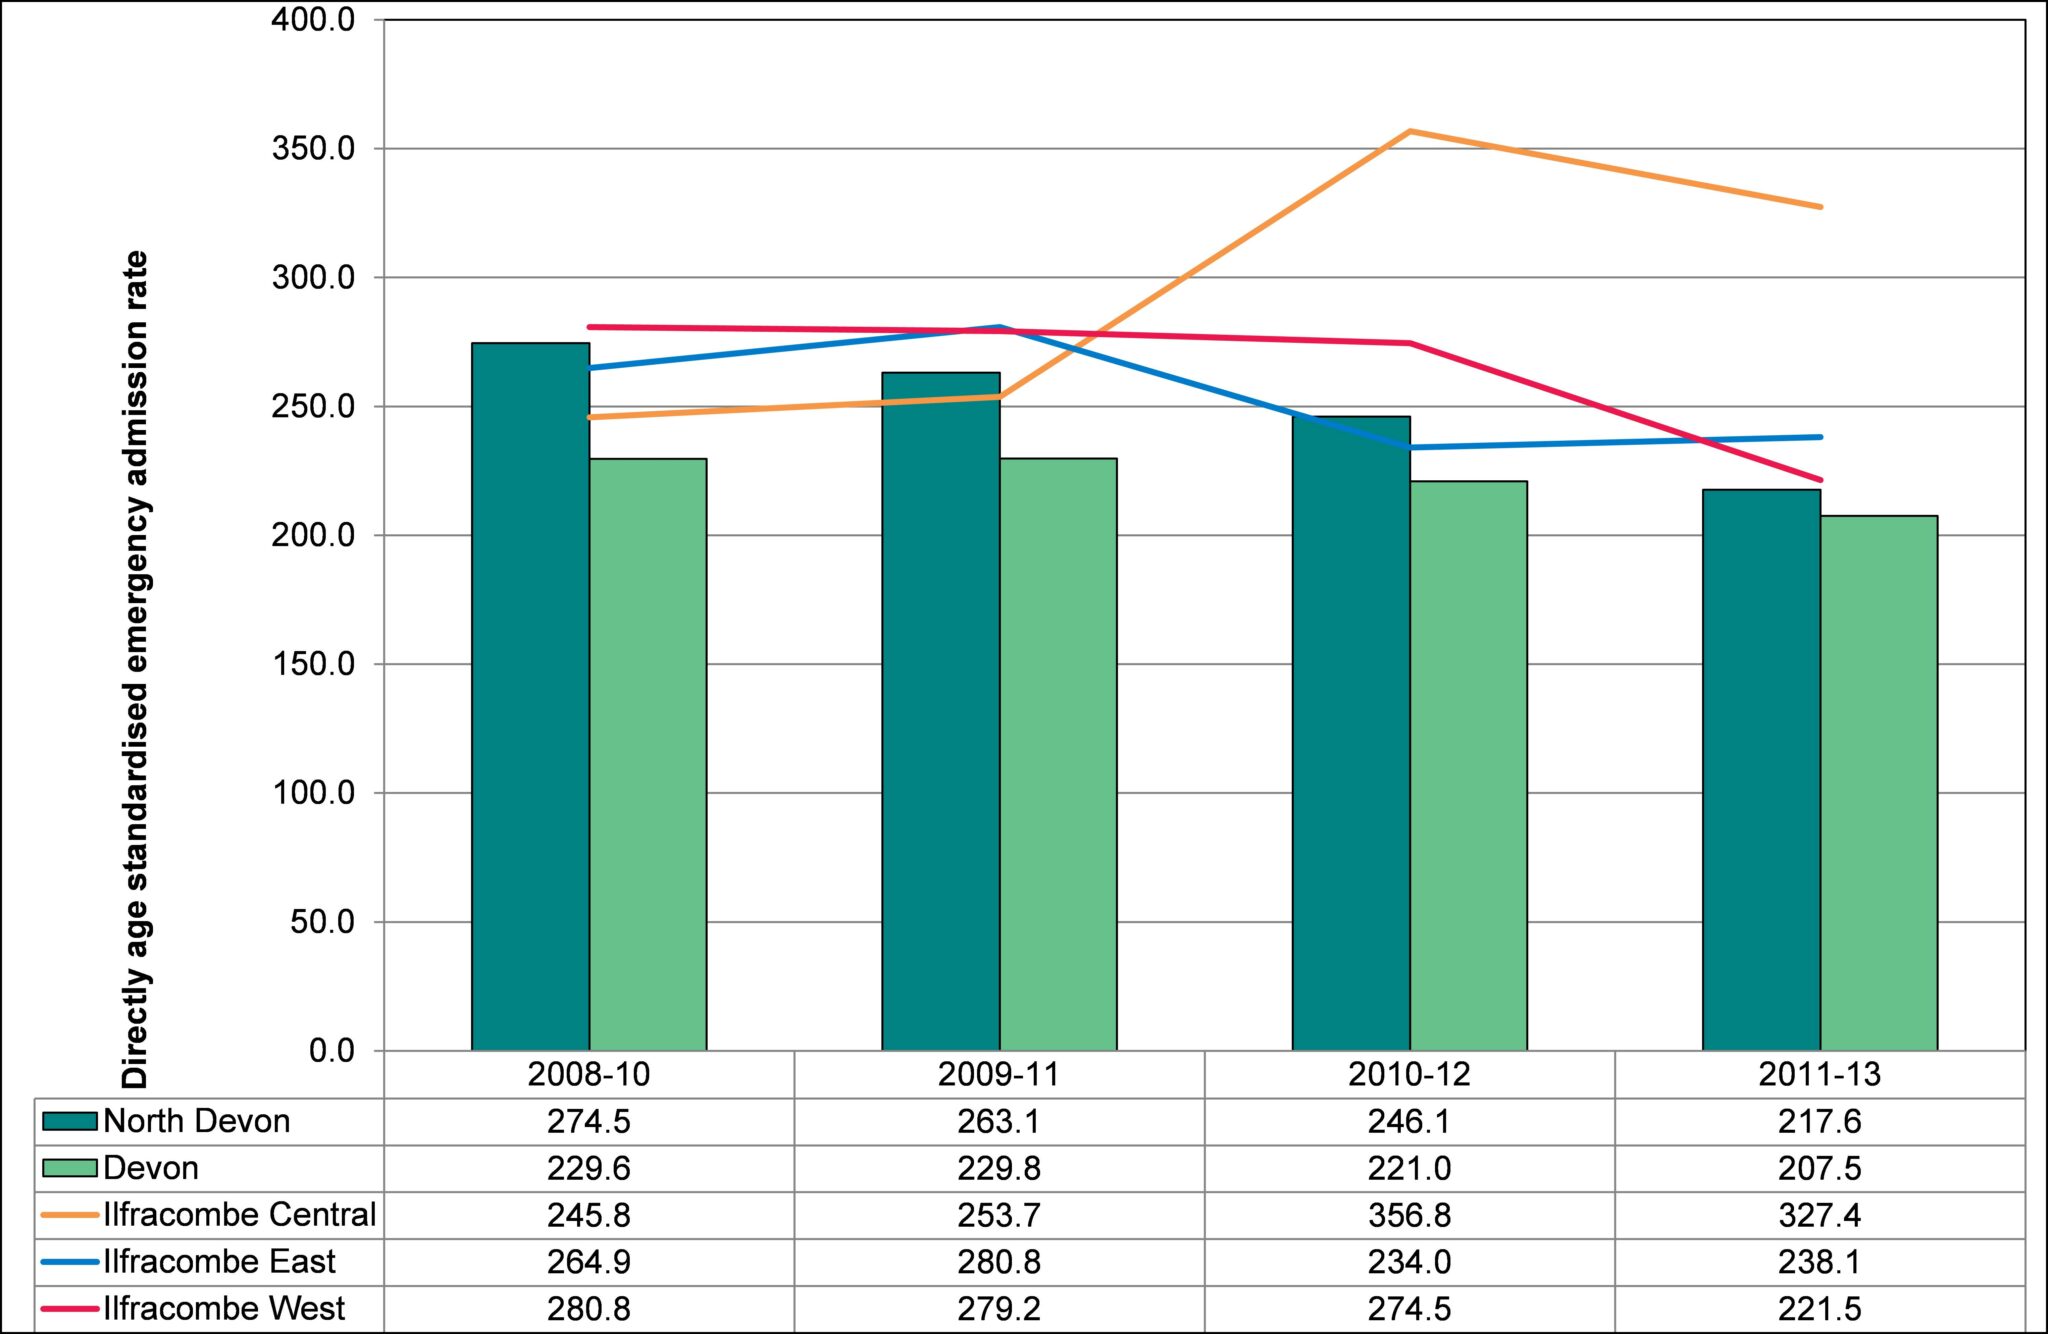
Figure 6.13: Emergency admissions for circulatory disease by Ilfracombe ward compared with North Devon and Devon, Direct Age-Standardised Rate per 100,000, 2008-10 to 2011-13.
Source: Secondary Uses Services, Inpatient Dataset, 2014
Figure 6.14: Emergency admissions for cancer by Ilfracombe ward compared with North Devon and Devon, Direct Age-Standardised Rate per 100,000, 2008-10 to 2011-13.

Source: Secondary Uses Services, Inpatient Dataset, 2014
Figure 6.15: Emergency admissions for respiratory disease by Ilfracombe ward compared with North Devon and Devon, Direct Age-Standardised Rate per 100,000, 2008-10 to 2011-13.
Source: Secondary Uses Services, Inpatient Dataset, 2014
Table 6.01: Percentage of population on selected disease registers compared to NHS Northern, Eastern and Western (NEW) Devon Clinical Commissioning Group and England, 2013-14.
| Practice Name | Coronary Heart Disease | Stroke | CVD (primary prevention) | Hypertension | COPD | Diabetes |
| Waterside | 4.69% | 2.33% | 2.78% | 14.25% | 2.18% | 6.41% |
| Warwick | 4.33% | 2.44% | 2.55% | 15.19% | 2.40% | 5.69% |
| NEW Devon CCG | 3.79% | 2.08% | 2.81% | 14.87% | 1.94% | 6.15% |
| England | 3.29% | 1.72% | 2.81% | 13.73% | 1.78% | 6.21% |
Source: Quality and Outcomes Framework 2013-14, Health and Social Care Information Centre, 2014