Life expectancy is the average period that a person can expect to live. Table 8.1 sets out the current average life expectancy in Devon, with males living 80.4 years and females living 84.2 years on average, a difference of 3.8 years. Figure 8.5 shows the trend in male and female life expectancy, highlighting that life expectancy has increased over recent years, and that life expectancy in Devon has been consistently above the England average.
Table 8.1, Average Life Expectancy at Birth in Years, Devon Local Authorities, 2012-14
| Area | Males | Females | ||
| Average Life Expectancy | 95% Confidence Interval | Average Life Expectancy | 95% Confidence Interval | |
| East Devon | 81.1 | (80.5 to 81.7) | 84.0 | (83.4 to 84.5) |
| Exeter | 79.4 | (78.8 to 80.0) | 84.4 | (83.8 to 85.0) |
| Mid Devon | 82.0 | (81.2 to 82.7) | 85.6 | (85.0 to 86.2) |
| North Devon | 79.7 | (79.0 to 80.4) | 83.4 | (82.9 to 84.0) |
| South Hams | 81.1 | (80.4 to 81.9) | 85.4 | (84.8 to 86.0) |
| Teignbridge | 80.1 | (79.5 to 80.7) | 84.2 | (83.7 to 84.8) |
| Torridge | 80.1 | (79.1 to 80.7) | 83.3 | (82.5 to 84.1) |
| West Devon | 79.9 | (78.6 to 80.6) | 85.0 | (84.3 to 85.8) |
| Devon | 80.5 | (80.2 to 80.7) | 84.4 | (84.2 to 84.6) |
| South West | 80.2 | (80.1 to 80.3) | 83.9 | (83.9 to 84.0) |
| England | 79.6 | (79.5 to 79.6) | 83.2 | (83.2 to 83.2) |
Source: Health and Social Care Information Centre, Compendium of Population Health Indicators, 2016
Figure 8.5, Trend in Average Life Expectancy in Years, 1991-93 to 2012-14

Source: Health and Social Care Information Centre, Compendium of Population Health Indicators, 2016
Substantial differences in average life expectancy exist within Devon, with shorter life expectancy seen in more deprived areas and areas with a high concentration of care homes. The shortest life expectancy at ward level in Devon is in Ilfracombe Central (74.9 years) which is 14 years less than the life expectancy in Orchard Hill in Torridge (88.8 years). Life expectancy is also significantly lower in certain groups including gypsies and travellers, the homeless and persons with moderate or severe learning disabilities.
Table 8.2, Overall, shortest and longest average life expectancy in years (LE) at birth by ward, Devon local authority districts, 2010 to 2014.
| District | Overall LE | Shortest LE | Longest LE | Gap (years) | ||
| Ward Name | LE | Name | LE | |||
| East Devon | 82.9 | Exmouth Littleham | 79.9 | Newton Poppleford and Harpford | 88.3 | 8.4 |
| Exeter | 81.9 | Newtown | 77.3 | Topsham | 86.4 | 9.1 |
| Mid Devon | 83.2 | Cullompton North | 79.5 | Taw Vale | 87.6 | 8.1 |
| North Devon | 81.7 | Ilfracombe Central | 74.9 | Chittlehampton | 87.4 | 13.1 |
| South Hams | 83.2 | Totnes Bridgetown | 78.7 | Ivybridge Woodlands | 87.5 | 8.8 |
| Teignbridge | 82.3 | Newton Abbot: College | 78.9 | Kerswell-with-Combe | 85.4 | 6.5 |
| Torridge | 81.7 | Holsworthy | 79.6 | Orchard Hill | 88.8 | 9.2 |
| West Devon | 82.4 | Hatherleigh | 80.1 | Milton Ford | 88.5 | 8.4 |
| Devon | 82.5 | Ilfracombe Central | 74.9 | Orchard Hill | 88.8 | 13.9 |
Source: Primary Care Mortality Database, and ONS Mid-Year Population Estimates, 2014
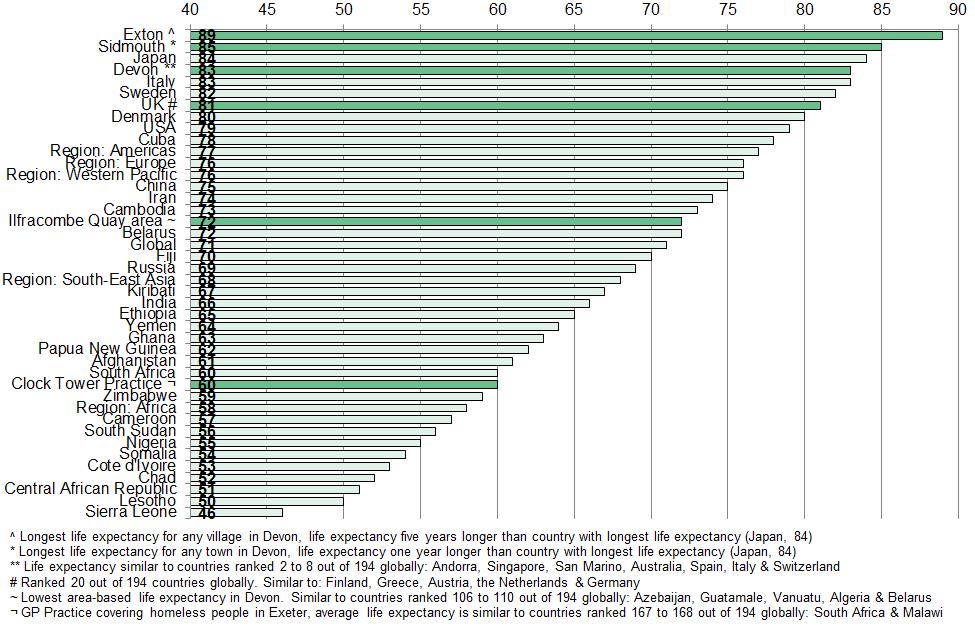
Figure 8.6 compares life expectancy in Devon with selected countries internationally. The town (Sidmouth, 85 years) and village (Exton, 89 years) with the longest life expectancy are higher than the country with the longest, which is only just above Devon. However, average life expectancy in the area with the lowest life expectancy (Ilfracombe Quay area, 72 years) and in the Clock Tower practice which supports the homeless and vulnerably housed population in Exeter (60 years) are significantly lower and place them with South American and African countries respectively in internationally rankings. Other groups experiencing shorter average life expectancy include gypsies and travellers, and people with learning disabilities.
Figure 8.6, Average life expectancy in Devon compared to regions and selected countries internationally, 2013
Source: World Health Organisation Global Health Observatory, 2016; Primary Care Mortality Dataset and Compendium of Population Health Indicators, 2015