The latest version of the Index of Multiple Deprivation for 2010 was published in March 2011, with the next version due later in 2015. Figure 7.1 shows Index of Multiple Deprivation 2010 figures by Lower Super Output Area (LSOA), which are small areas of similar size created by the Office for National Statistics). This suggests just below 5% of the Devon population live in the most deprived national quintile (one-fifth). These areas include parts of Exeter, Ilfracombe, Barnstaple, Bideford, Dawlish, Dartmouth, Teignmouth, Newton Abbot and Tiverton. Just over 10% of the Devon population were in the least deprived quintile. While overall levels of deprivation across Devon are lower than the national average, there are issues in relation to rural and urban deprivation which seem to affect Devon differently than is experienced elsewhere. With Devon being a largely rural county this is an important difference to be explored. Within Devon rural areas are generally more deprived than rural areas elsewhere in England, whilst urban areas are generally less deprived than urban areas nationally. Figure 7.2 compares average deprivation scores for urban and rural areas in the district areas in Devon. Whilst urban areas are usually more deprived than rural areas, the rural areas surrounding a number of towns in Devon are more deprived than the town itself, including Crediton, Great Torrington, Holsworthy, Honiton, Okehampton, South Molton and Tavistock.
Figure 7.3 shows the percentage of the Devon population in each national indices of deprivation quintile for the overall index, the individual domains, and the supplementary income deprivation indices for children and older people. This reveals there are typically fewer areas at the extremes, with lower proportions in the most deprived or least deprived quintiles for the overall index of multiple deprivation (IMD), the income, employment, health, education domains, and the income measures for children and older people, with most areas being in the below average or average groups. Relatively low levels or crime, road traffic accidents and generally good air quality mean the majority of areas in Devon are in the least deprived quintile nationally for the crime and outdoor environment domains. This is largely reversed in the barriers domain (accessibility and affordability of housing, and distance from local services) with 32.5% of the Devon population in the most deprived group nationally, and the indoor environment domain (houses failing to meet the decent homes standard or without central heating), with 47.3% of the Devon population in the most deprived group nationally.
The local areas in the most deprived 20% nationally are listed in more detail below, with links out to detailed community baseline profiles for the areas:
- Exeter Central – two LSOAs, Profiles 1 2
- Ilfracombe Central – three LSOAs, Profiles 1 2 3
- Exeter Wonford, Whipton and Beacon Heath – seven LSOAs, Profiles 1 2 3 4 5 6 7
- Barnstaple Central– one LSOA, Profile
- Barnstaple Forches and Whiddon Down– two LSOAs, Profiles 1 2
- Bideford Central– one LSOA, Profile
- Teignmouth West – one LSOA, Profile
- Newton Abbot Buckland – one LSOA, Profile
- Exmouth Littleham – one LSOA, Profile
- Dartmouth Townstal – one LSOA, Profile
- Tiverton Queensway / Beech Road – one LSOA, Profile
- Dawlish Strand, Seafront and High Street – one LSOA, Profile
Figure 7.1, Map of Devon showing Lower Super Output Areas according to Index of Multiple Deprivation, 2010

Source: Indices of Deprivation 2010, Department for Communities and Local Government
Figure 7.2, Index of Multiple Deprivation, 2010 by Devon district and rurality
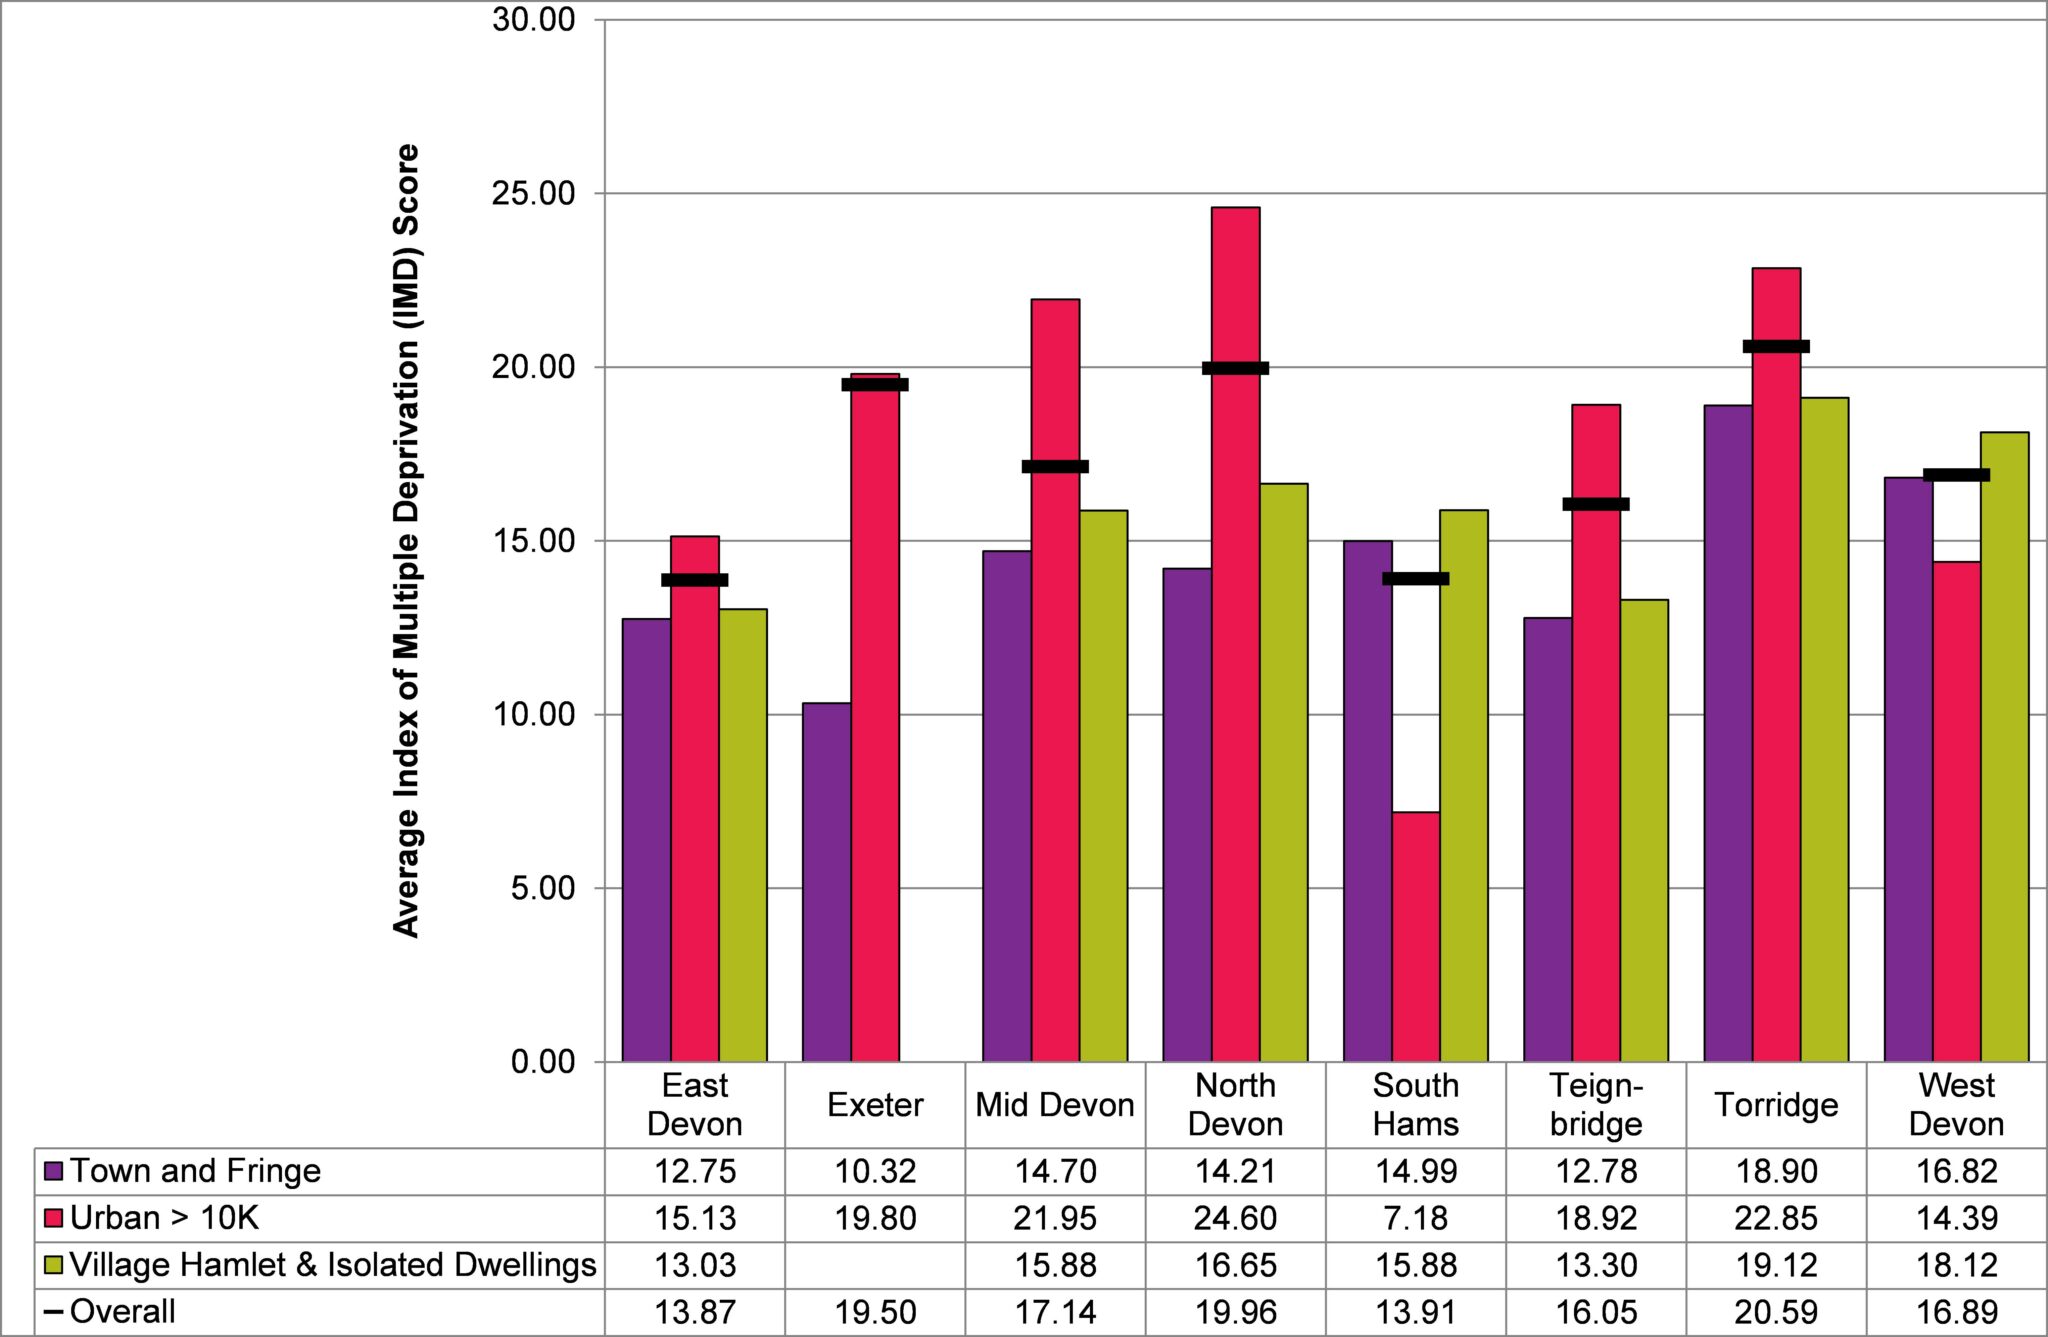
Source: Indices of Deprivation 2010/Urban and Rural Classification 2004, Department for Communities and Local Government
Figure 7.3, Percentage of Devon Population in each Indices of Deprivation Quintile by Domain, 2010

Source: Indices of Deprivation 2010, Department for Communities and Local Government