The latest version of the Index of Multiple Deprivation for 2015 was published in September 2015. Figure 7.1 shows Index of Multiple Deprivation 2010 figures by Lower Super Output Area (LSOA), which are small areas of similar size created by the Office for National Statistics). This suggests just below 5% of the Devon population live in the most deprived national quintile (one-fifth). These areas include parts of Exeter, Ilfracombe, Barnstaple, Bideford, Northam, Teignmouth, and Newton Abbot. Around 15% of the Devon population were in the least deprived quintile. While overall levels of deprivation across Devon are lower than the national average, there are issues in relation to rural and urban deprivation which seem to affect Devon differently than is experienced elsewhere. With Devon being a largely rural county this is an important difference to be explored. Within Devon rural areas are generally more deprived than rural areas elsewhere in England, whilst urban areas are generally less deprived than urban areas nationally. Figure 7.2 compares average deprivation scores for urban and rural areas in Devon compared to England with a further comparison between more accessible areas of South and East Devon and less accessible areas of North and West Devon. This highlights that deprivation in Devon is above the national average for rural towns and fringes, and urban cities and towns in a sparse setting, with North and West Devon above the England average for all individual urban/rural classifications. This is further illustrated by the fact that whilst urban areas are usually more deprived than rural areas, the rural areas surrounding a number of towns in Devon are more deprived than the town itself, including Crediton, Great Torrington, Holsworthy, Honiton, Okehampton, South Molton and Tavistock.
Figure 7.3 shows the percentage of the Devon population in each national indices of deprivation quintile for the overall index, the individual domains, and the supplementary income deprivation indices for children and older people. This reveals that there are typically fewer areas at the extremes, with lower proportions in the most deprived or least deprived quintiles for the overall index of multiple deprivation (IMD), the income, employment, health, education domains, and the income measures for children and older people, with most areas being in the below average or average groups. Relatively low levels or crime, road traffic accidents and generally good air quality mean the majority of areas in Devon are in the least deprived quintile nationally for the crime and outdoor environment domains. This is largely reversed in the barriers domain (distance from local services and accessibility and affordability of housing) with 27.45% of the Devon population in the most deprived group nationally, and the indoor environment domain (houses failing to meet the decent homes standard or without central heating), with 54.55% of the Devon population in the most deprived group nationally.
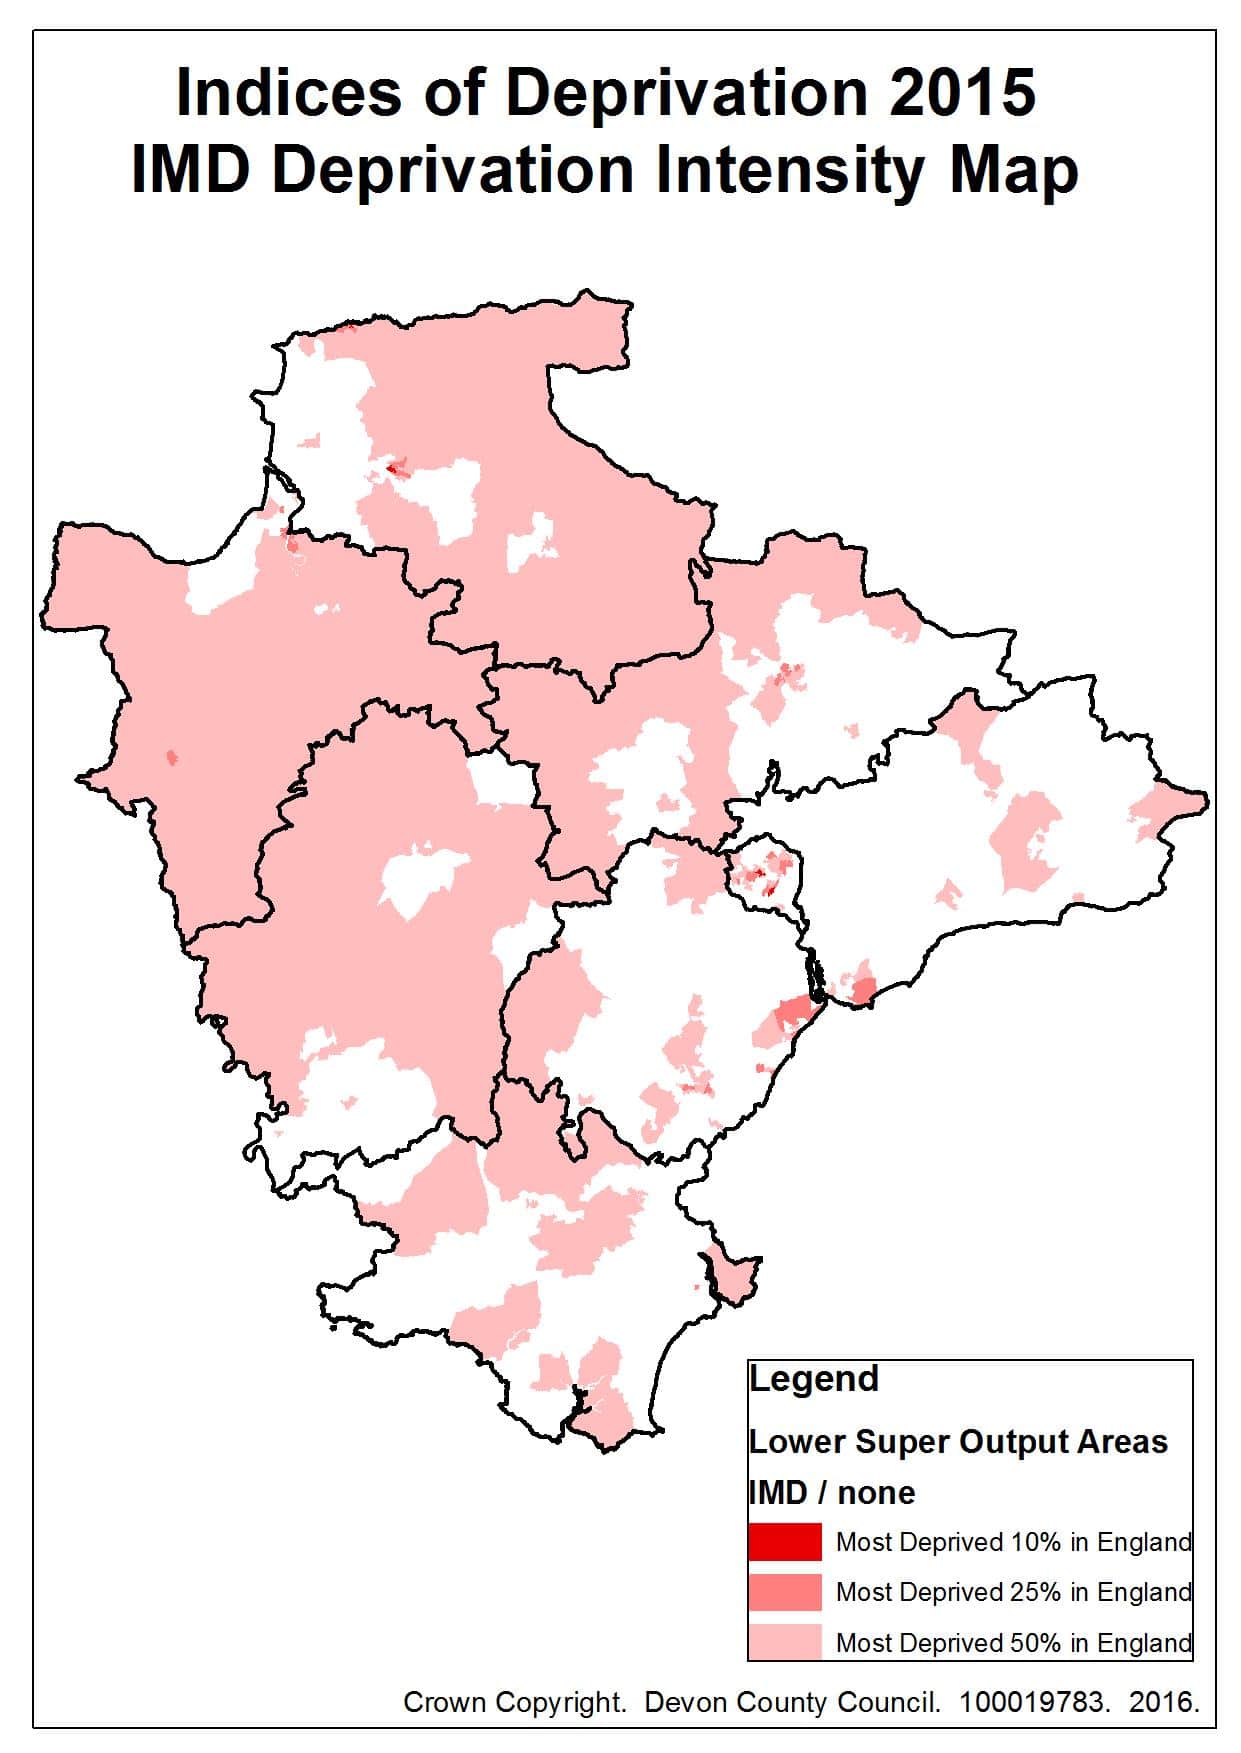
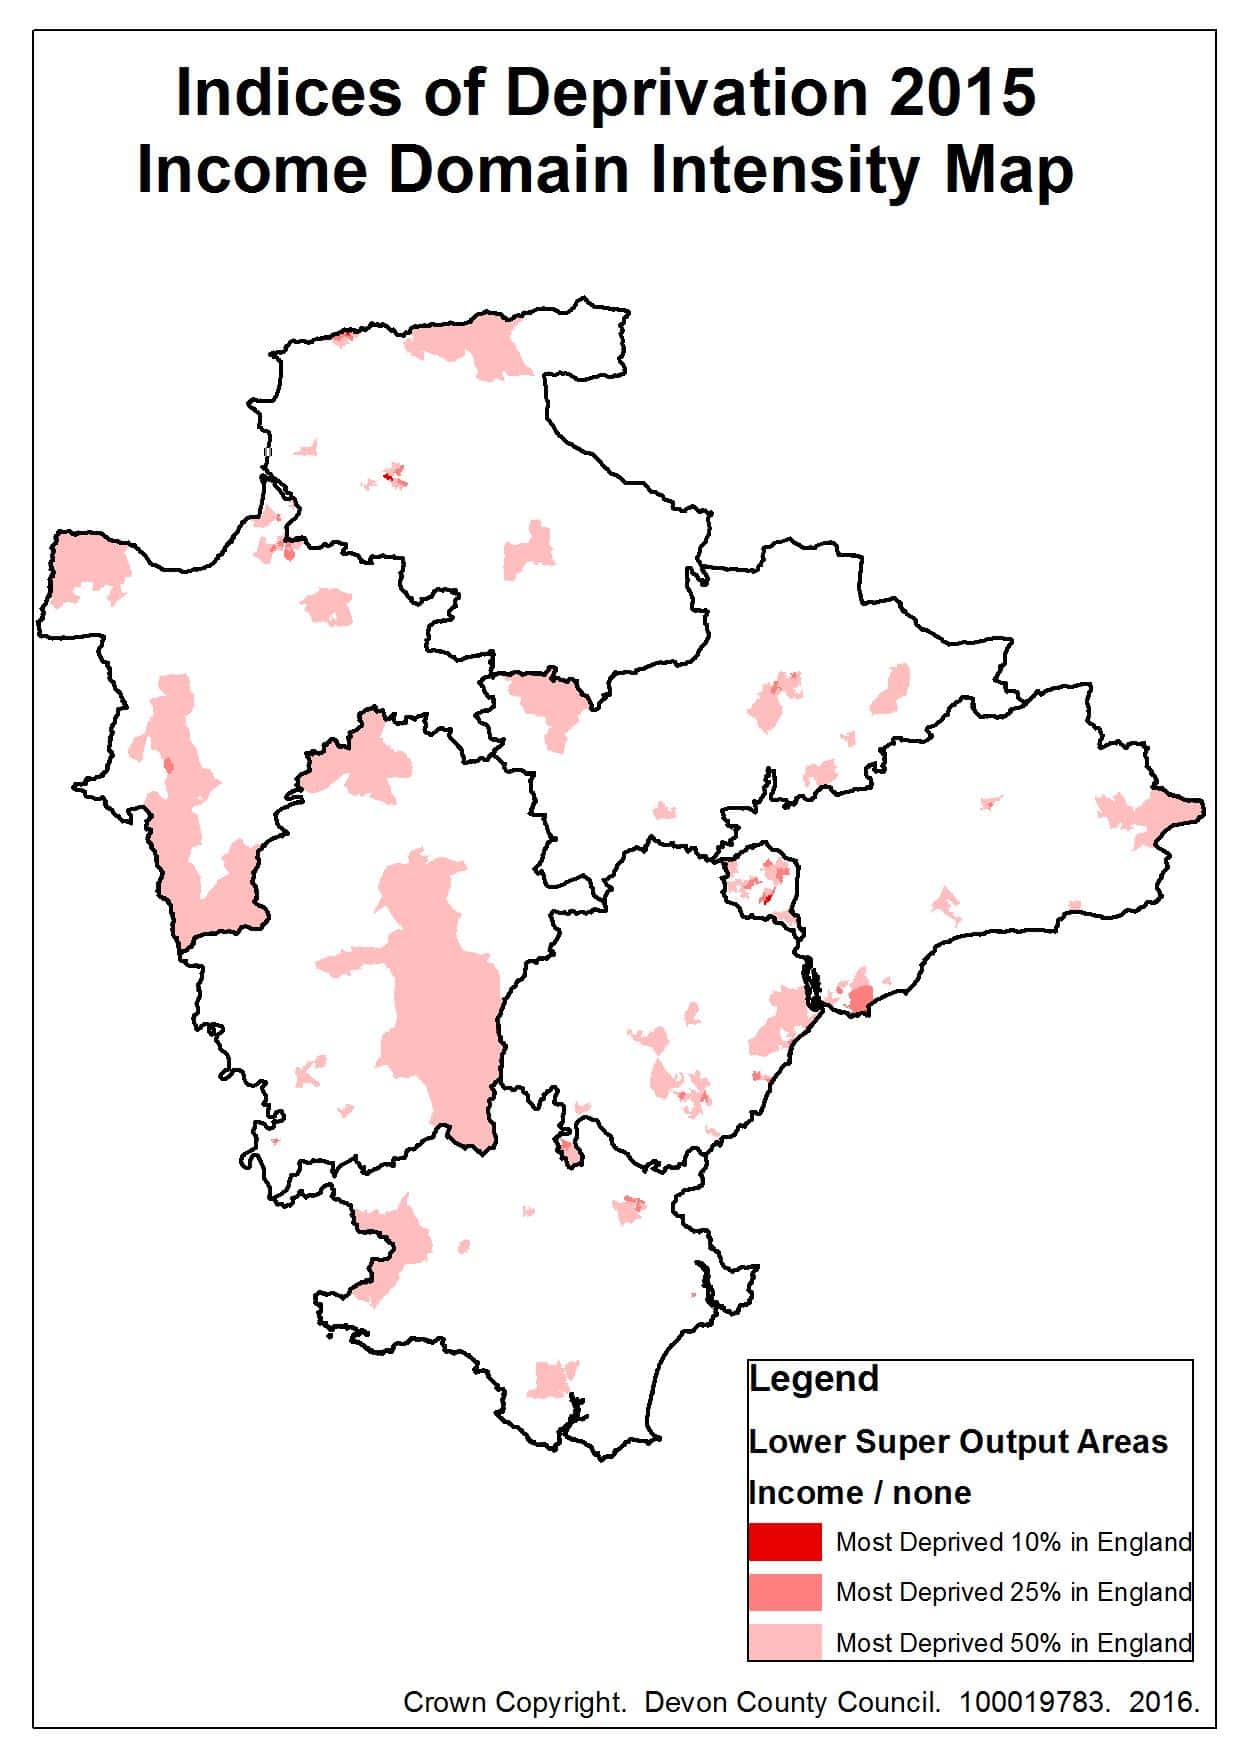
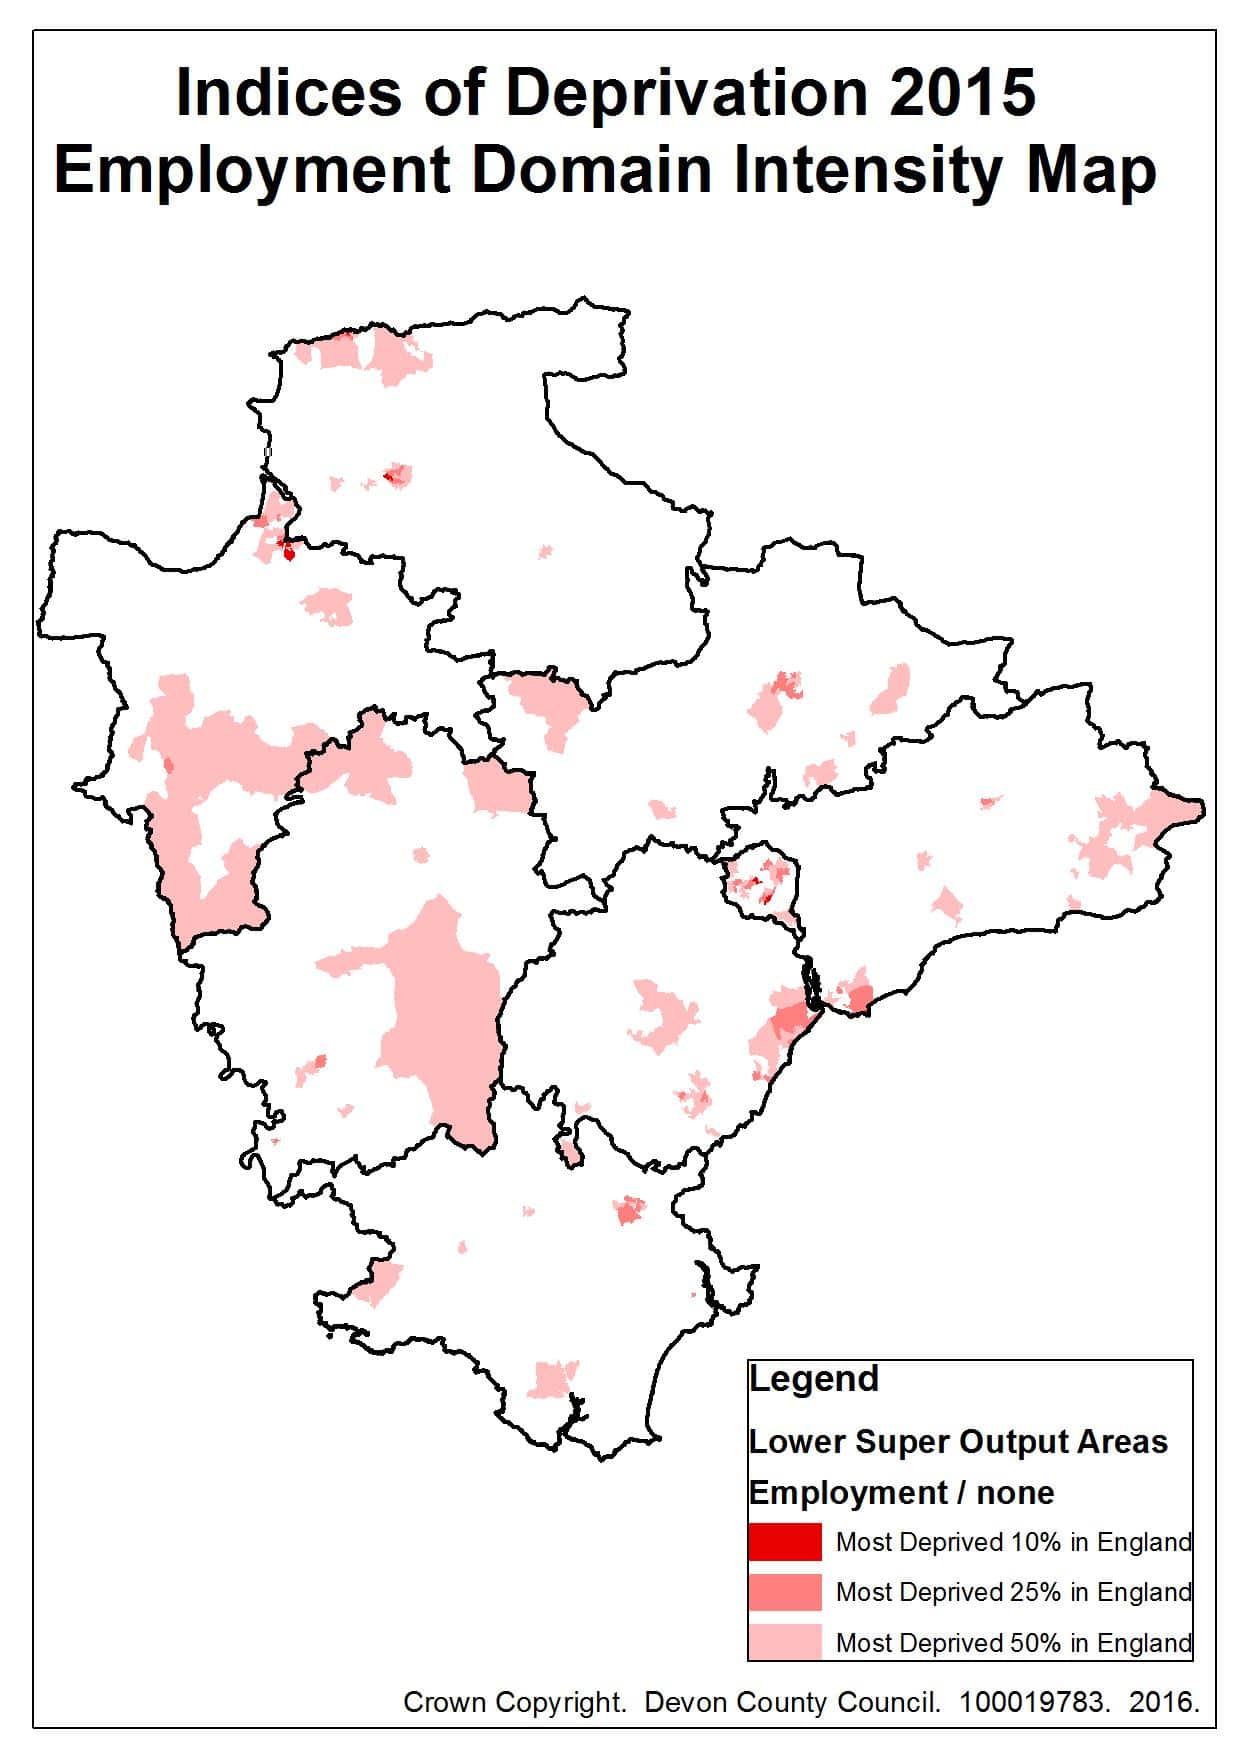
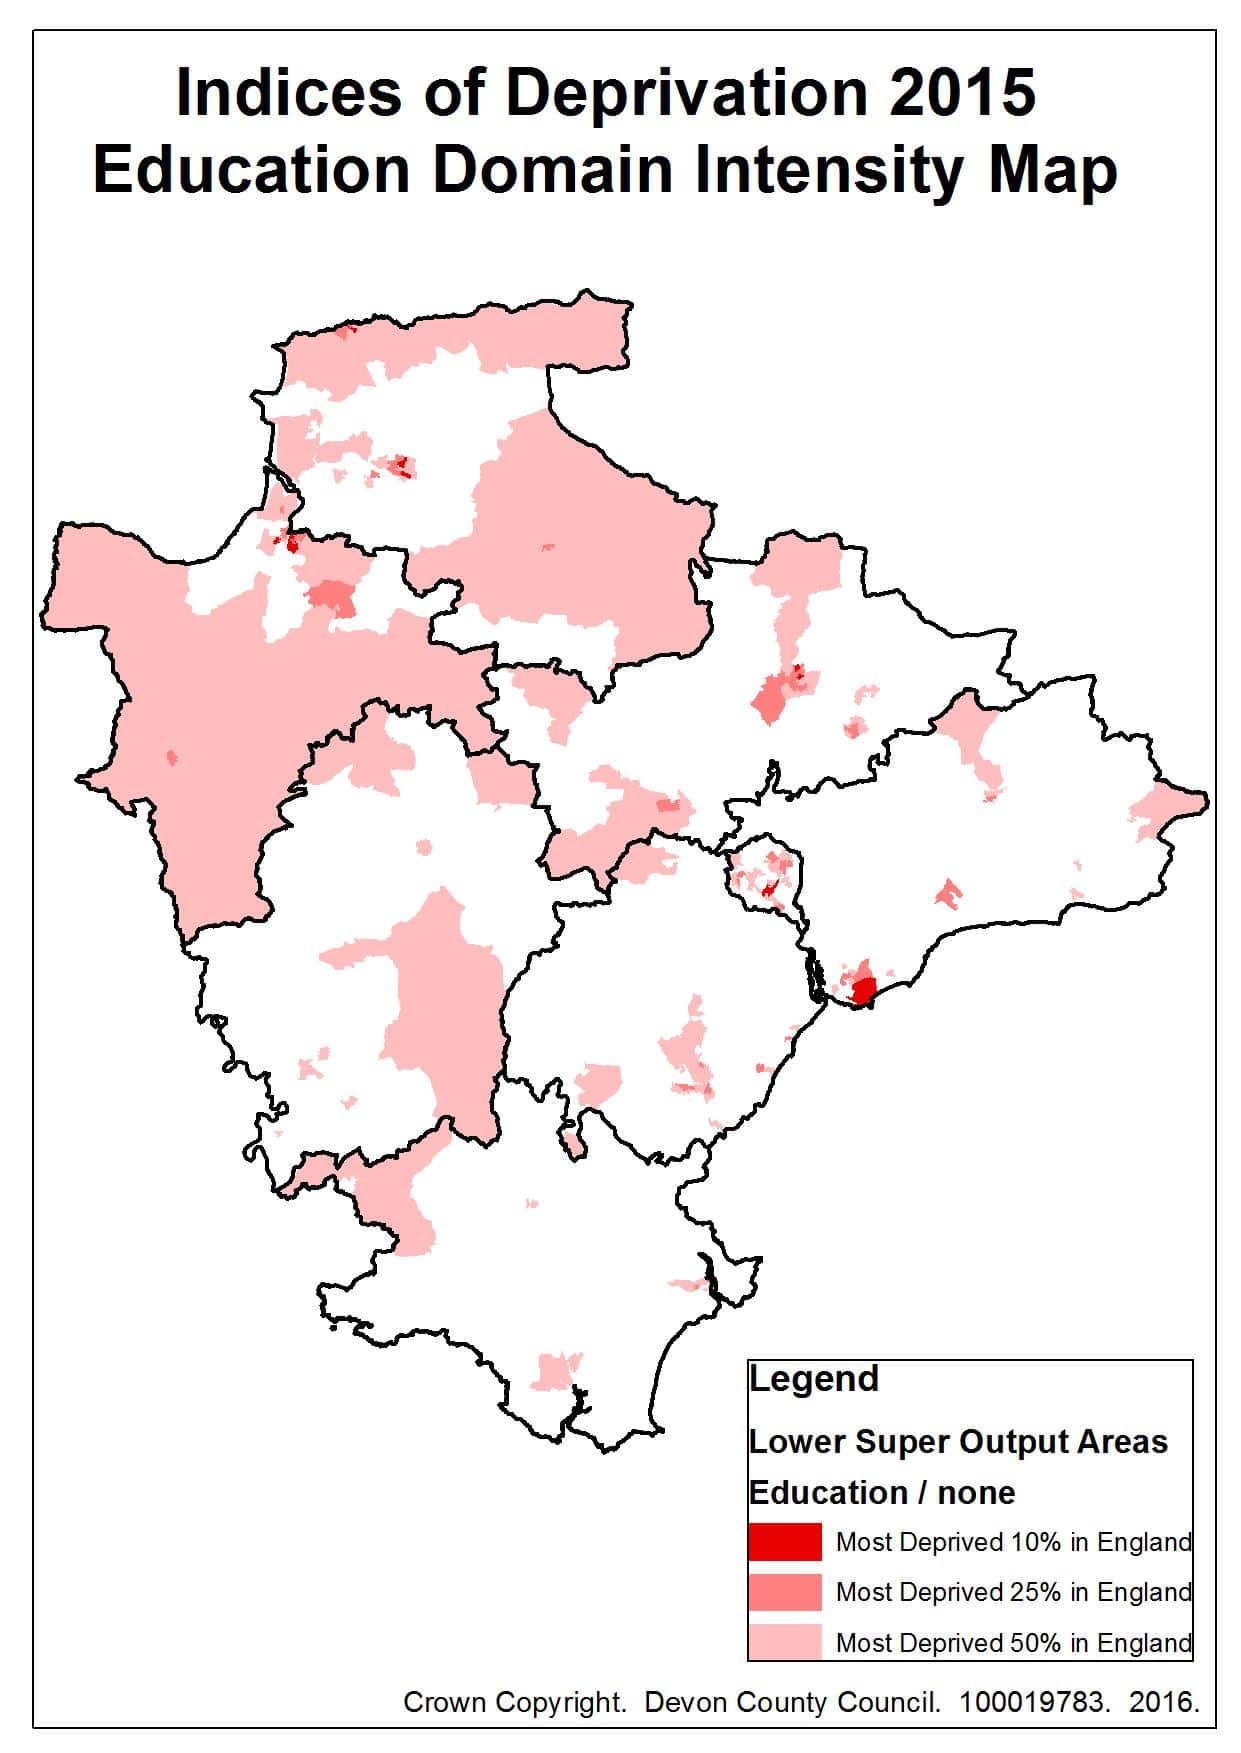
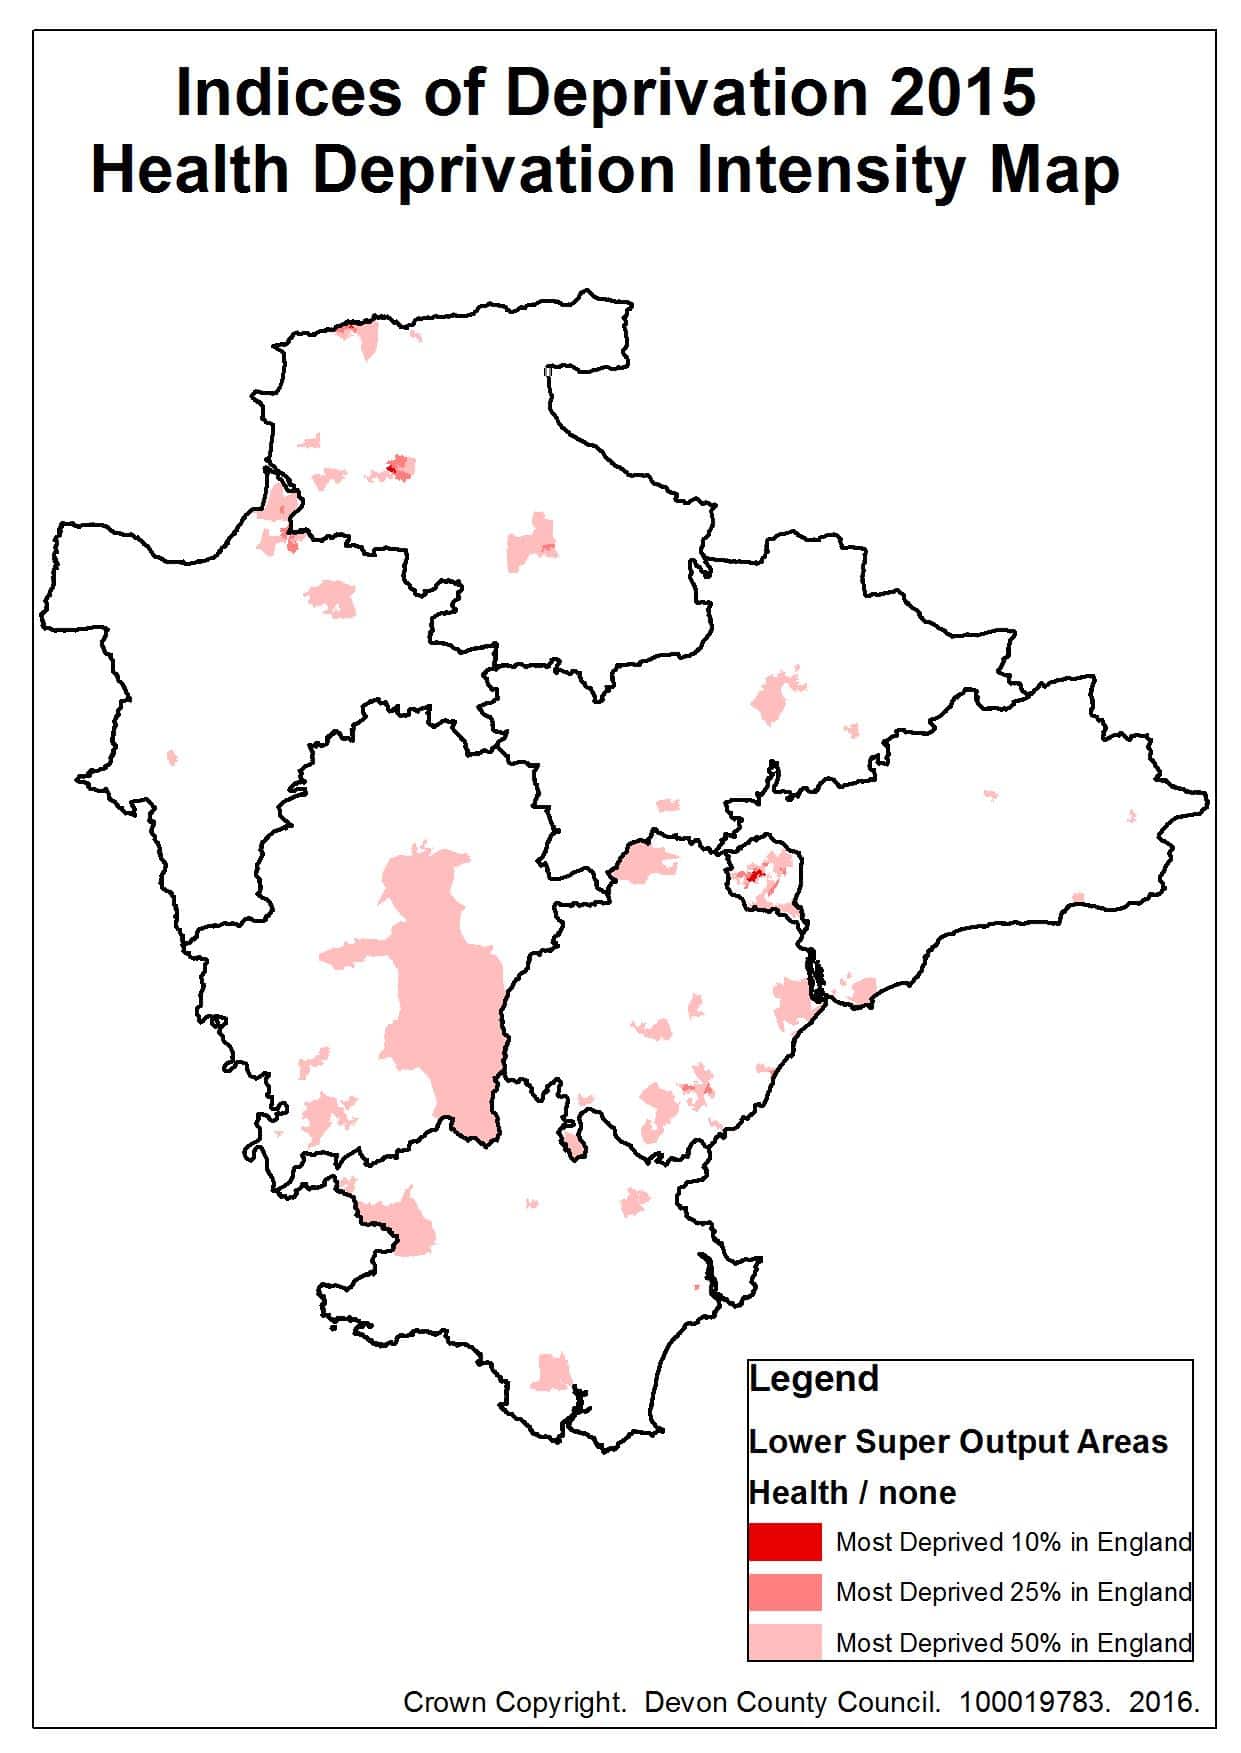
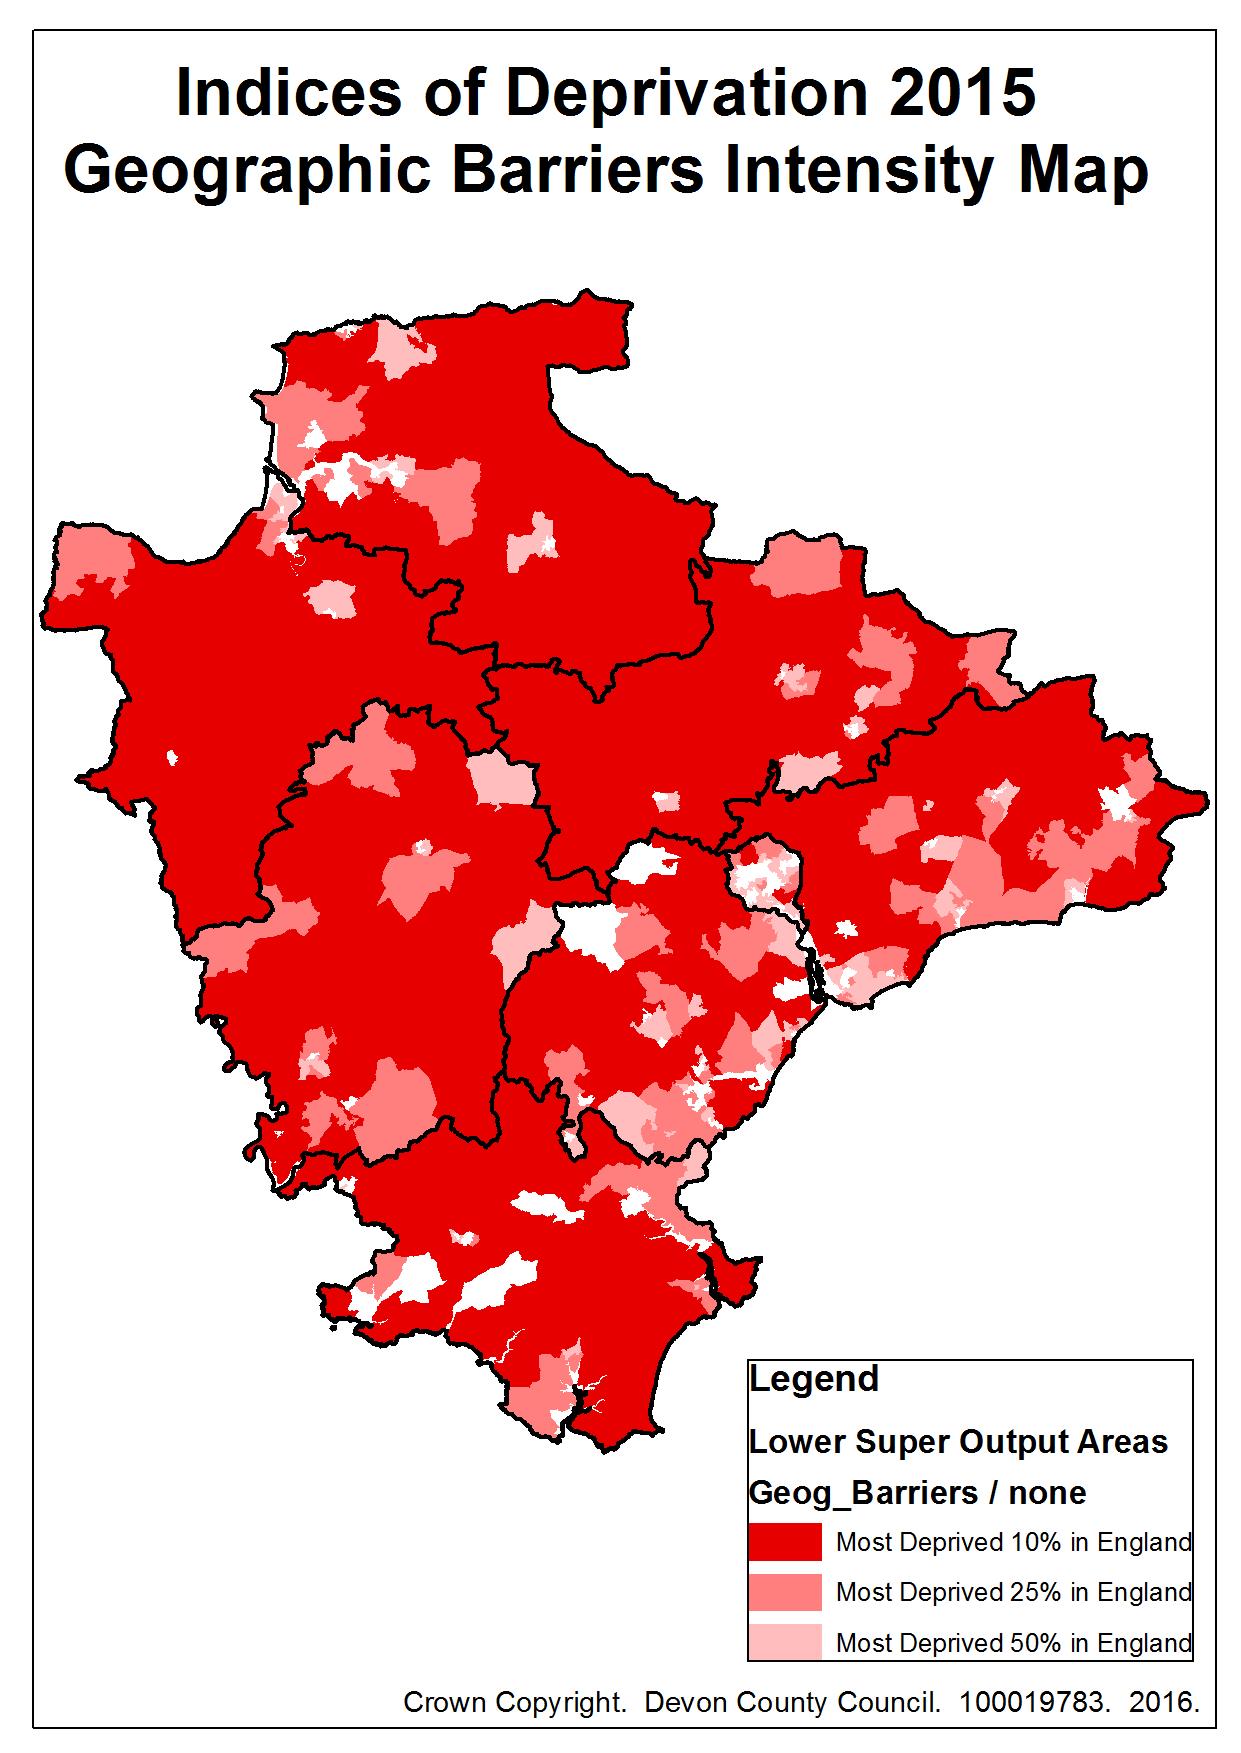
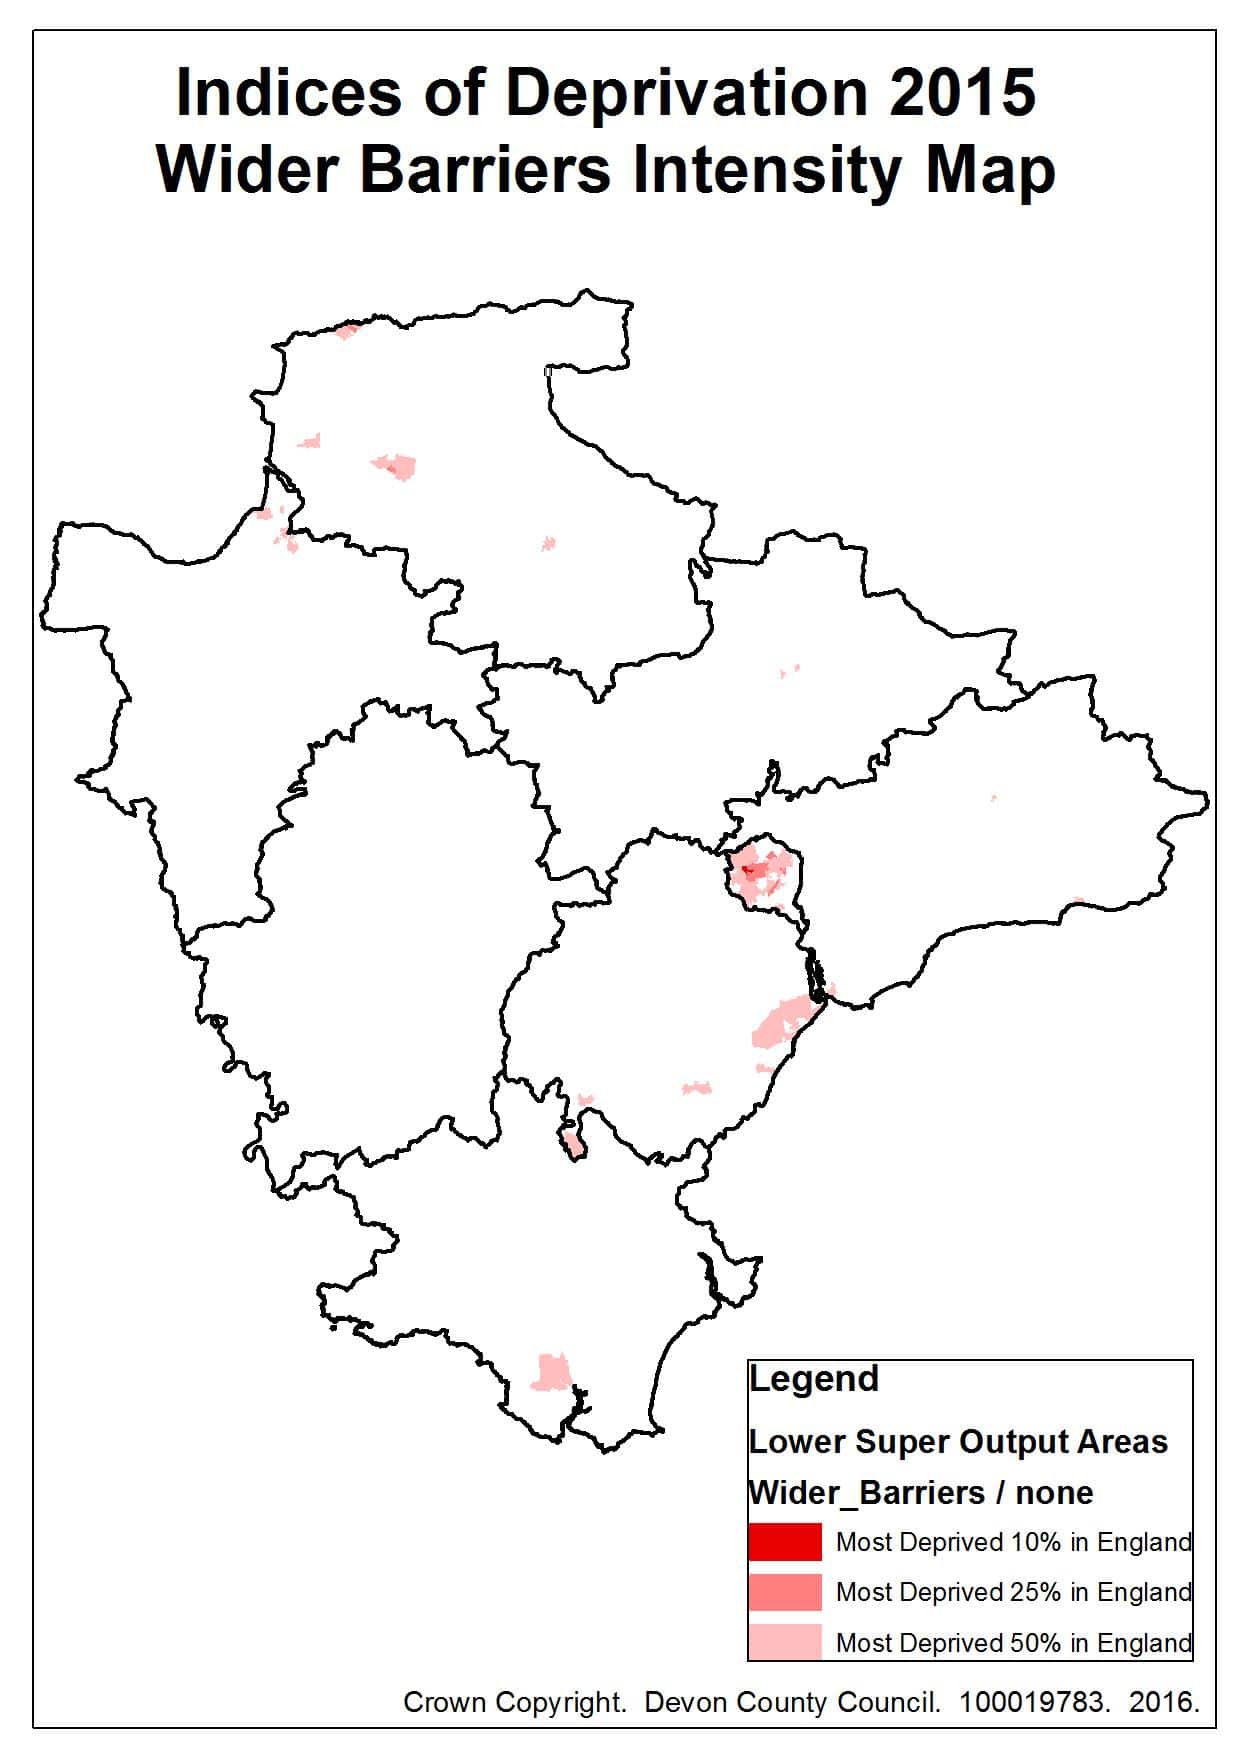
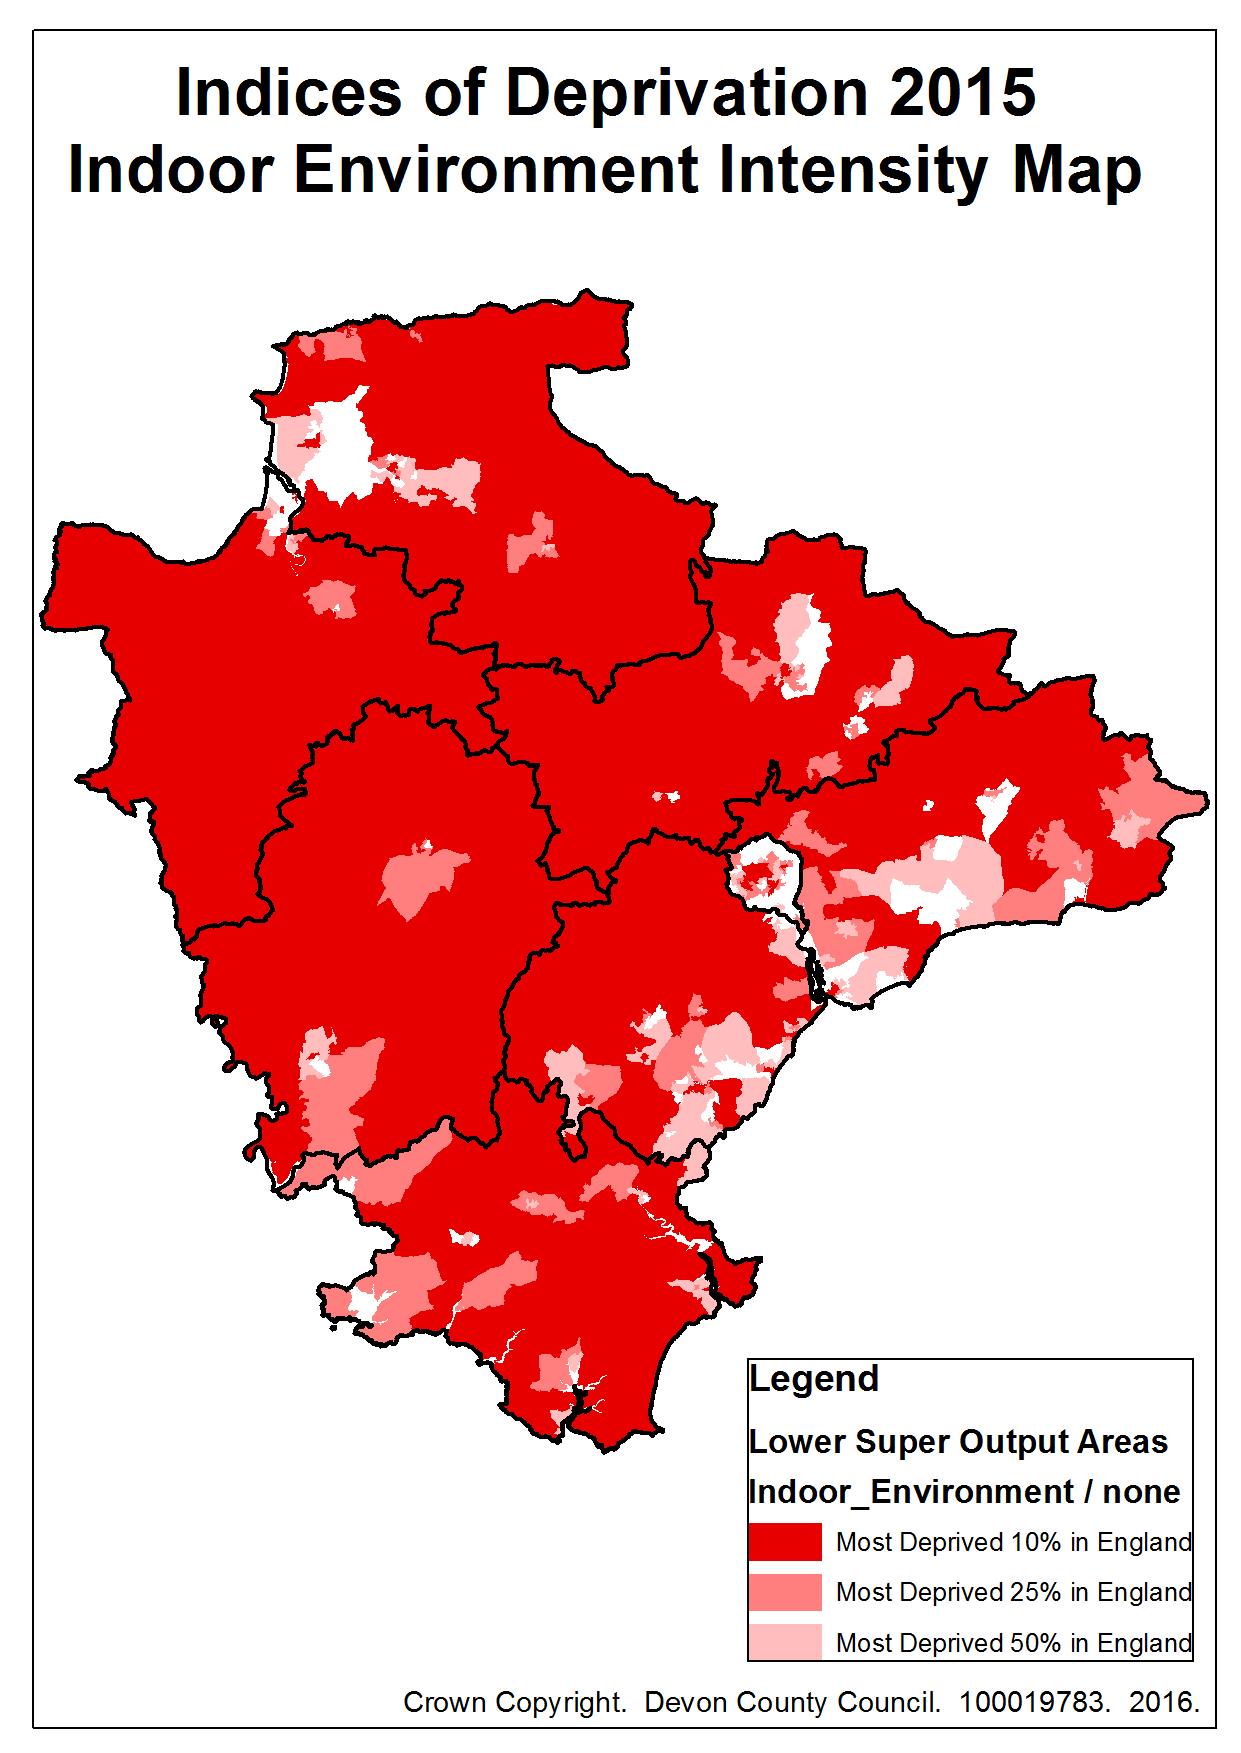
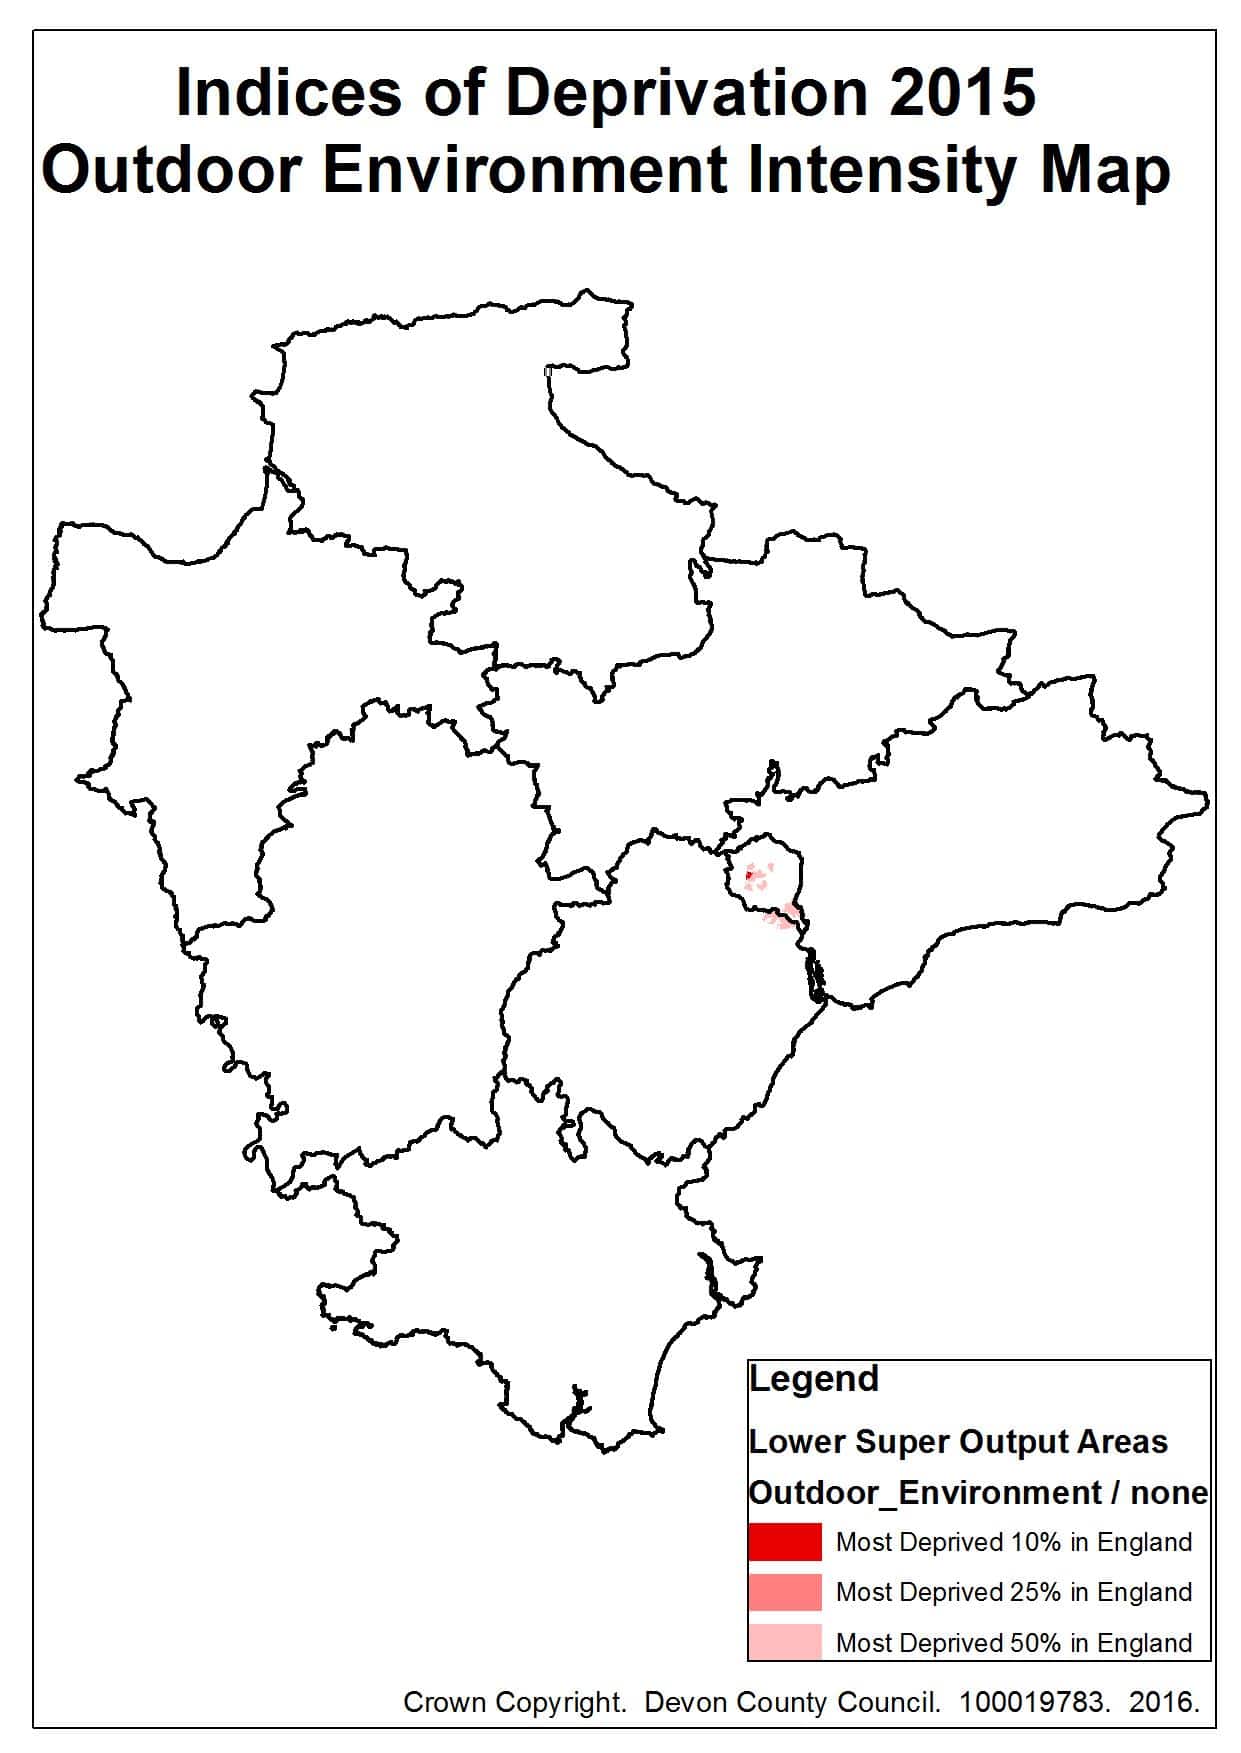
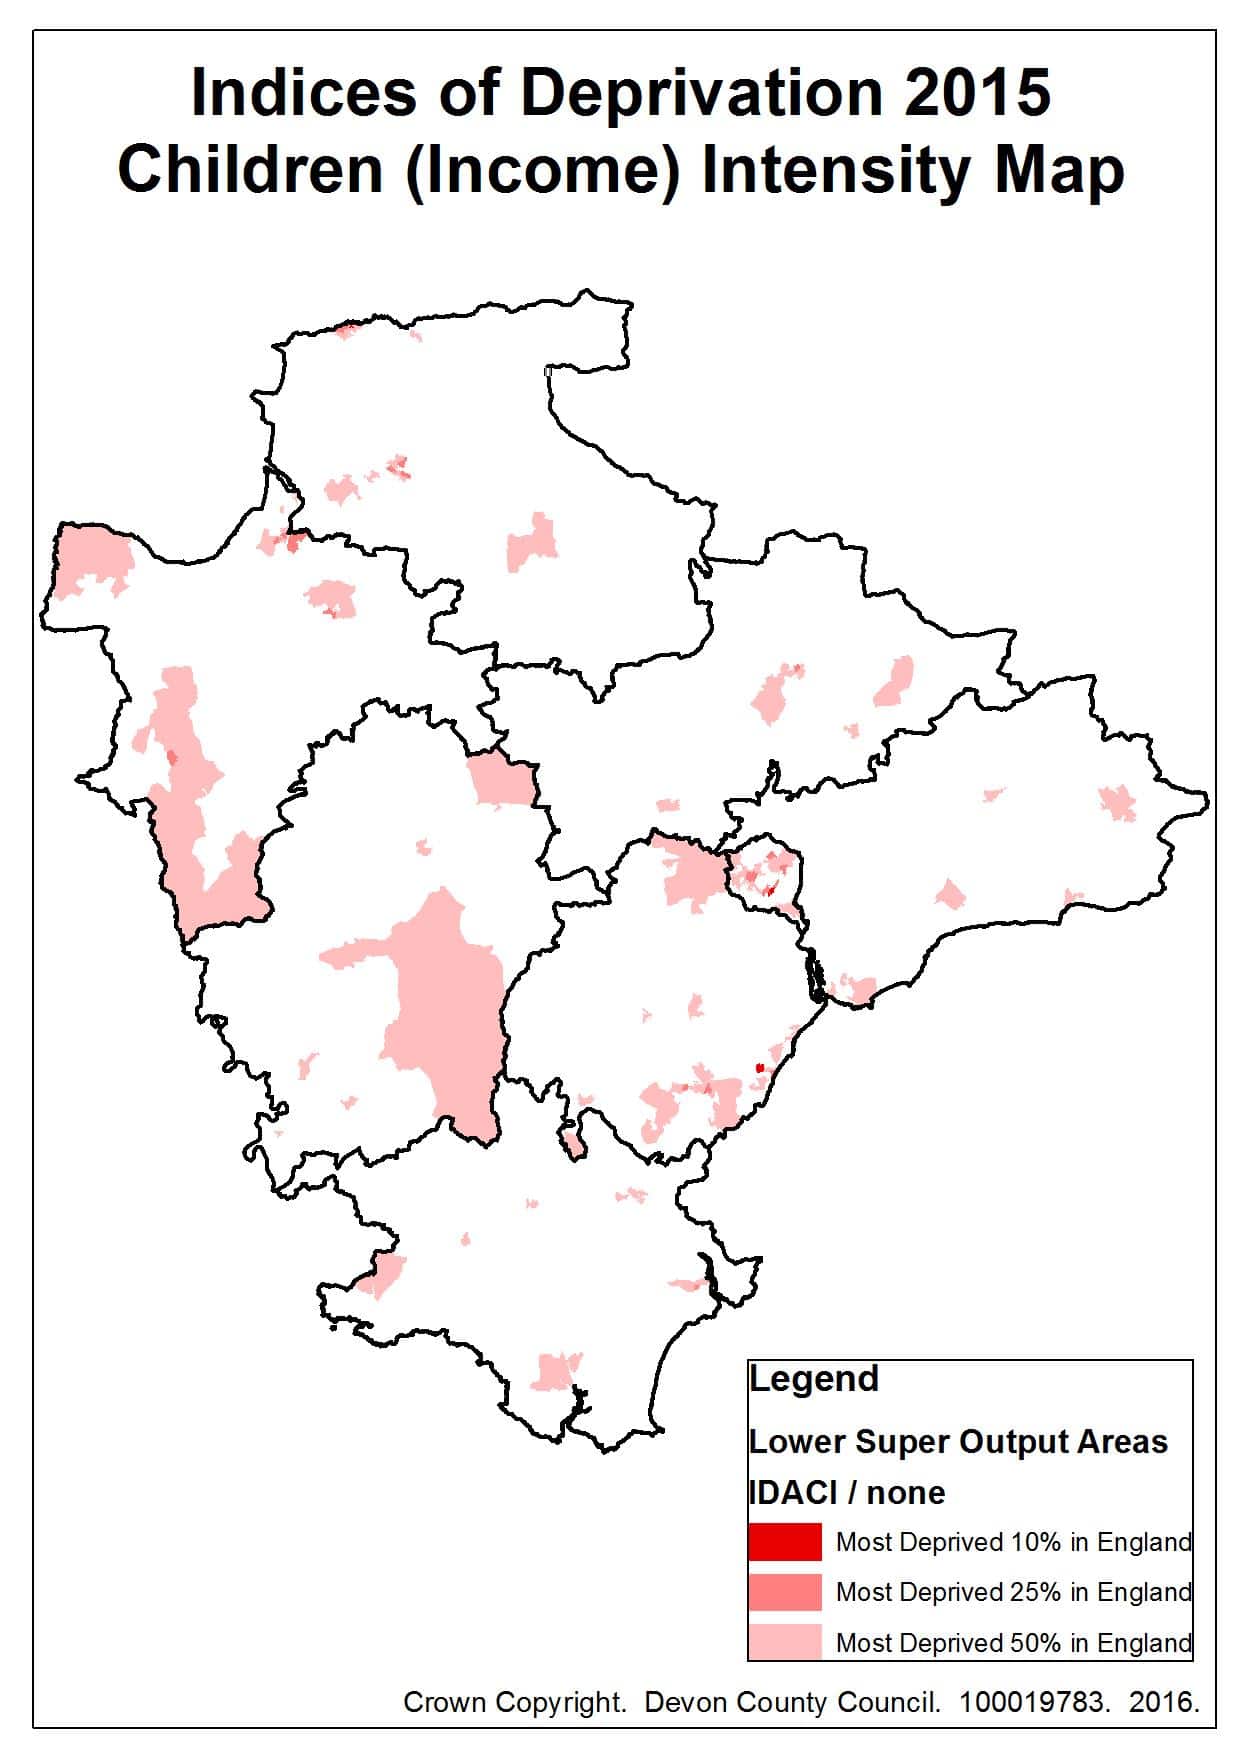
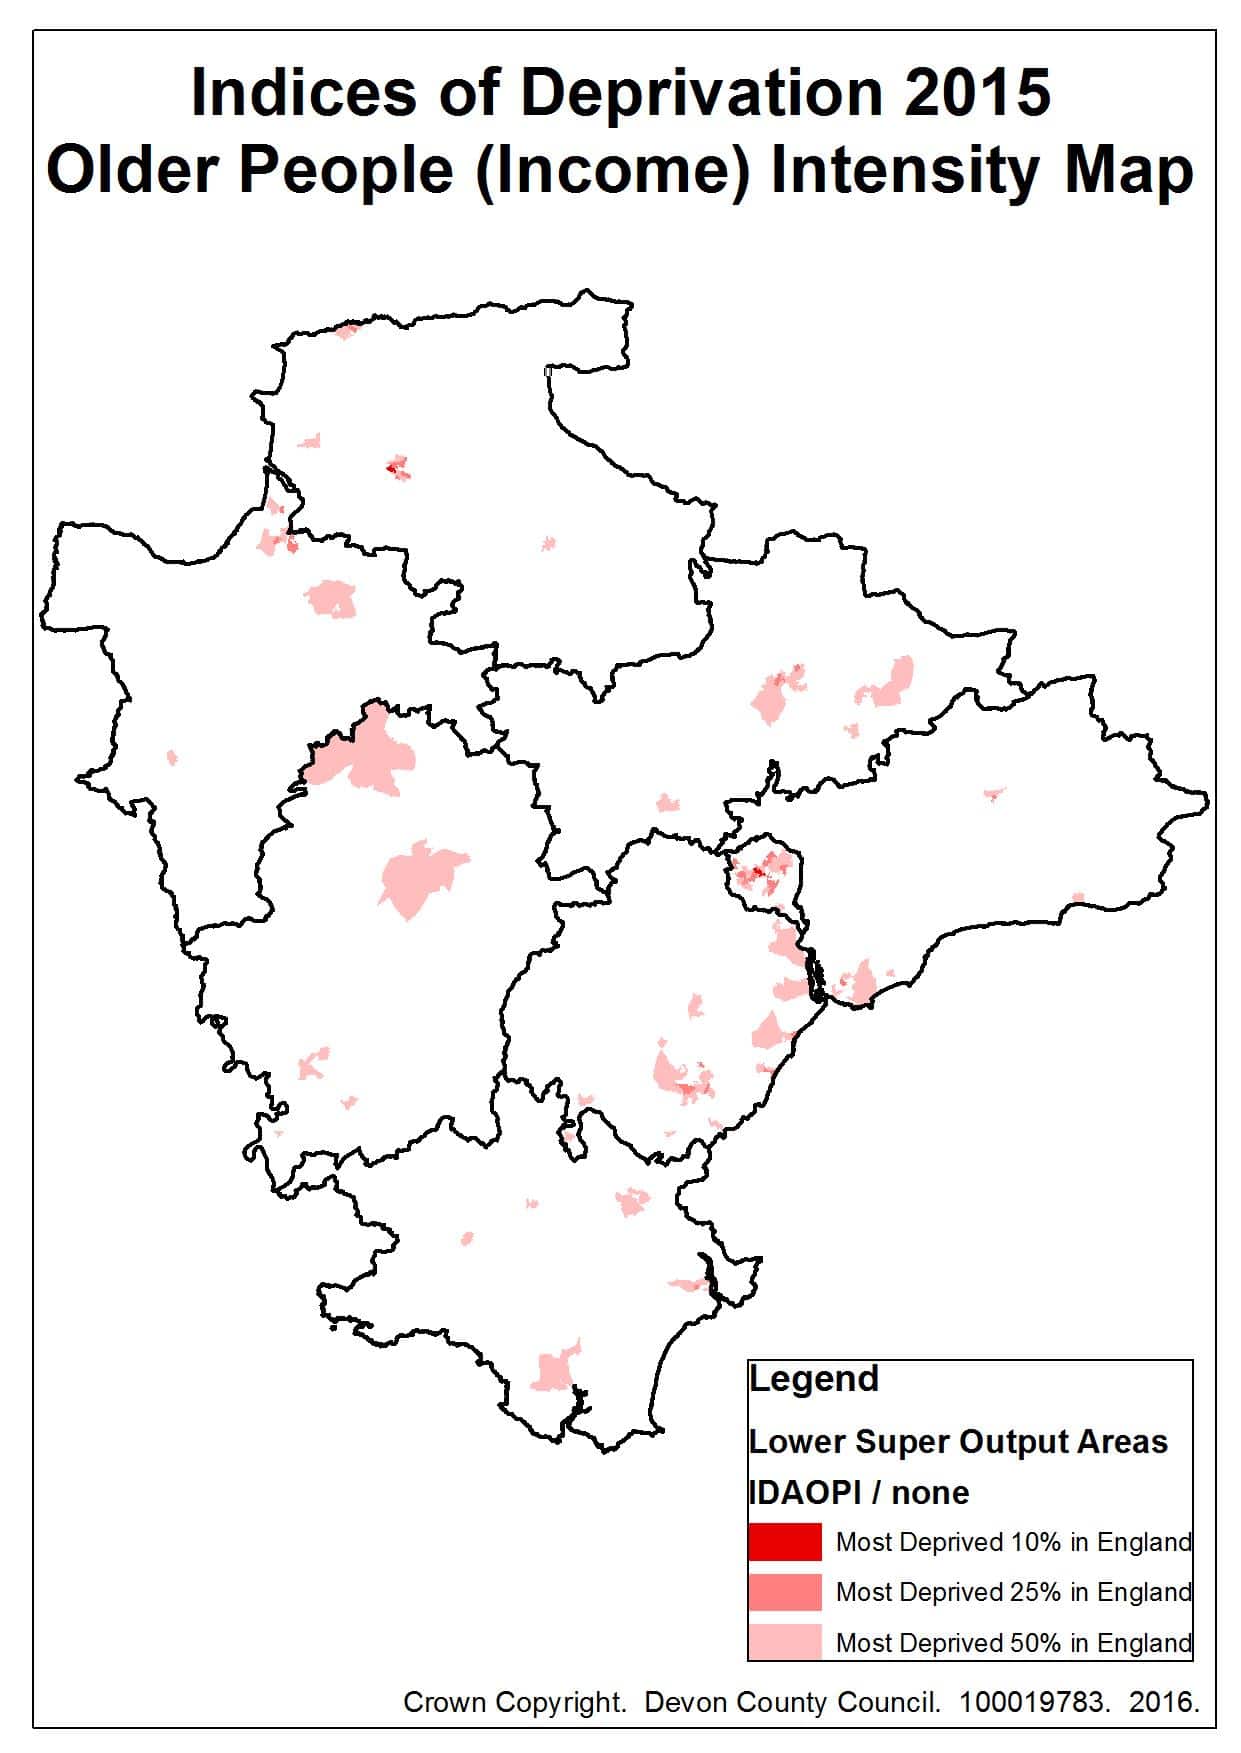
Figures 7.4 to 7.15 are a series of intensity maps showing Devon areas in the most deprived 10%, 25% and 50% nationally for the Index of Multiple Deprivation and individual domains, sub-domains and supplementary indices. This highlights that large rural areas of North and West Devon are above the national average (top 50%), with significant pockets of deprivation in Exeter and towns including Ilfracombe, Barnstaple, Bideford, Tiverton, Bradworthy, Tiverton, Dawlish, Exmouth, Teignmouth and Dartmouth. In relation to individual domains Tiverton, Exmouth, Honiton and large areas of Northern Devon are high on the education domain. The crime domain is centred on larger urban centres like Exeter, Newton Abbot, Barnstaple, Tiverton and Ilfracombe with pockets of rural crime particularly in remote moorland areas. Separate maps are provided for the two barriers to housing and services sub-domains, with the geographic barriers to services (road distance to GP, primary school, post office and store facilities) affecting most rural areas and urban fringes in Devon, compared to the wider barriers sub-domain (access to housing / homelessness), which is centred on Exeter and other urban populations. The indoor environment sub-domain (housing quality and central heating) highlights significant deprivation across the county, whilst the outdoor environment sub-domain (air quality and road traffic collisions affecting pedestrians and cyclists) reveals only minor pockets of deprivation centred on the Exeter area.
Table 7.1 sets out the 20 Lower Super Output Areas (LSOAs) in Devon in the most deprived 20% of areas nationally in the 2015 Indices of Deprivation (based on the Index of Multiple Deprivation). The table below is ranked with the most deprived LSOA appearing at the top. A link to the JSNA profile for the area is provided, along with a description of the area, and summary data on population, deprivation, lifestyle and life expectancy highlighting the relationship between are deprivation, healthy-related behaviour and poorer health outcomes.
Figure 7.1, Map of Devon showing Lower Super Output Areas according to Index of Multiple Deprivation, 2015
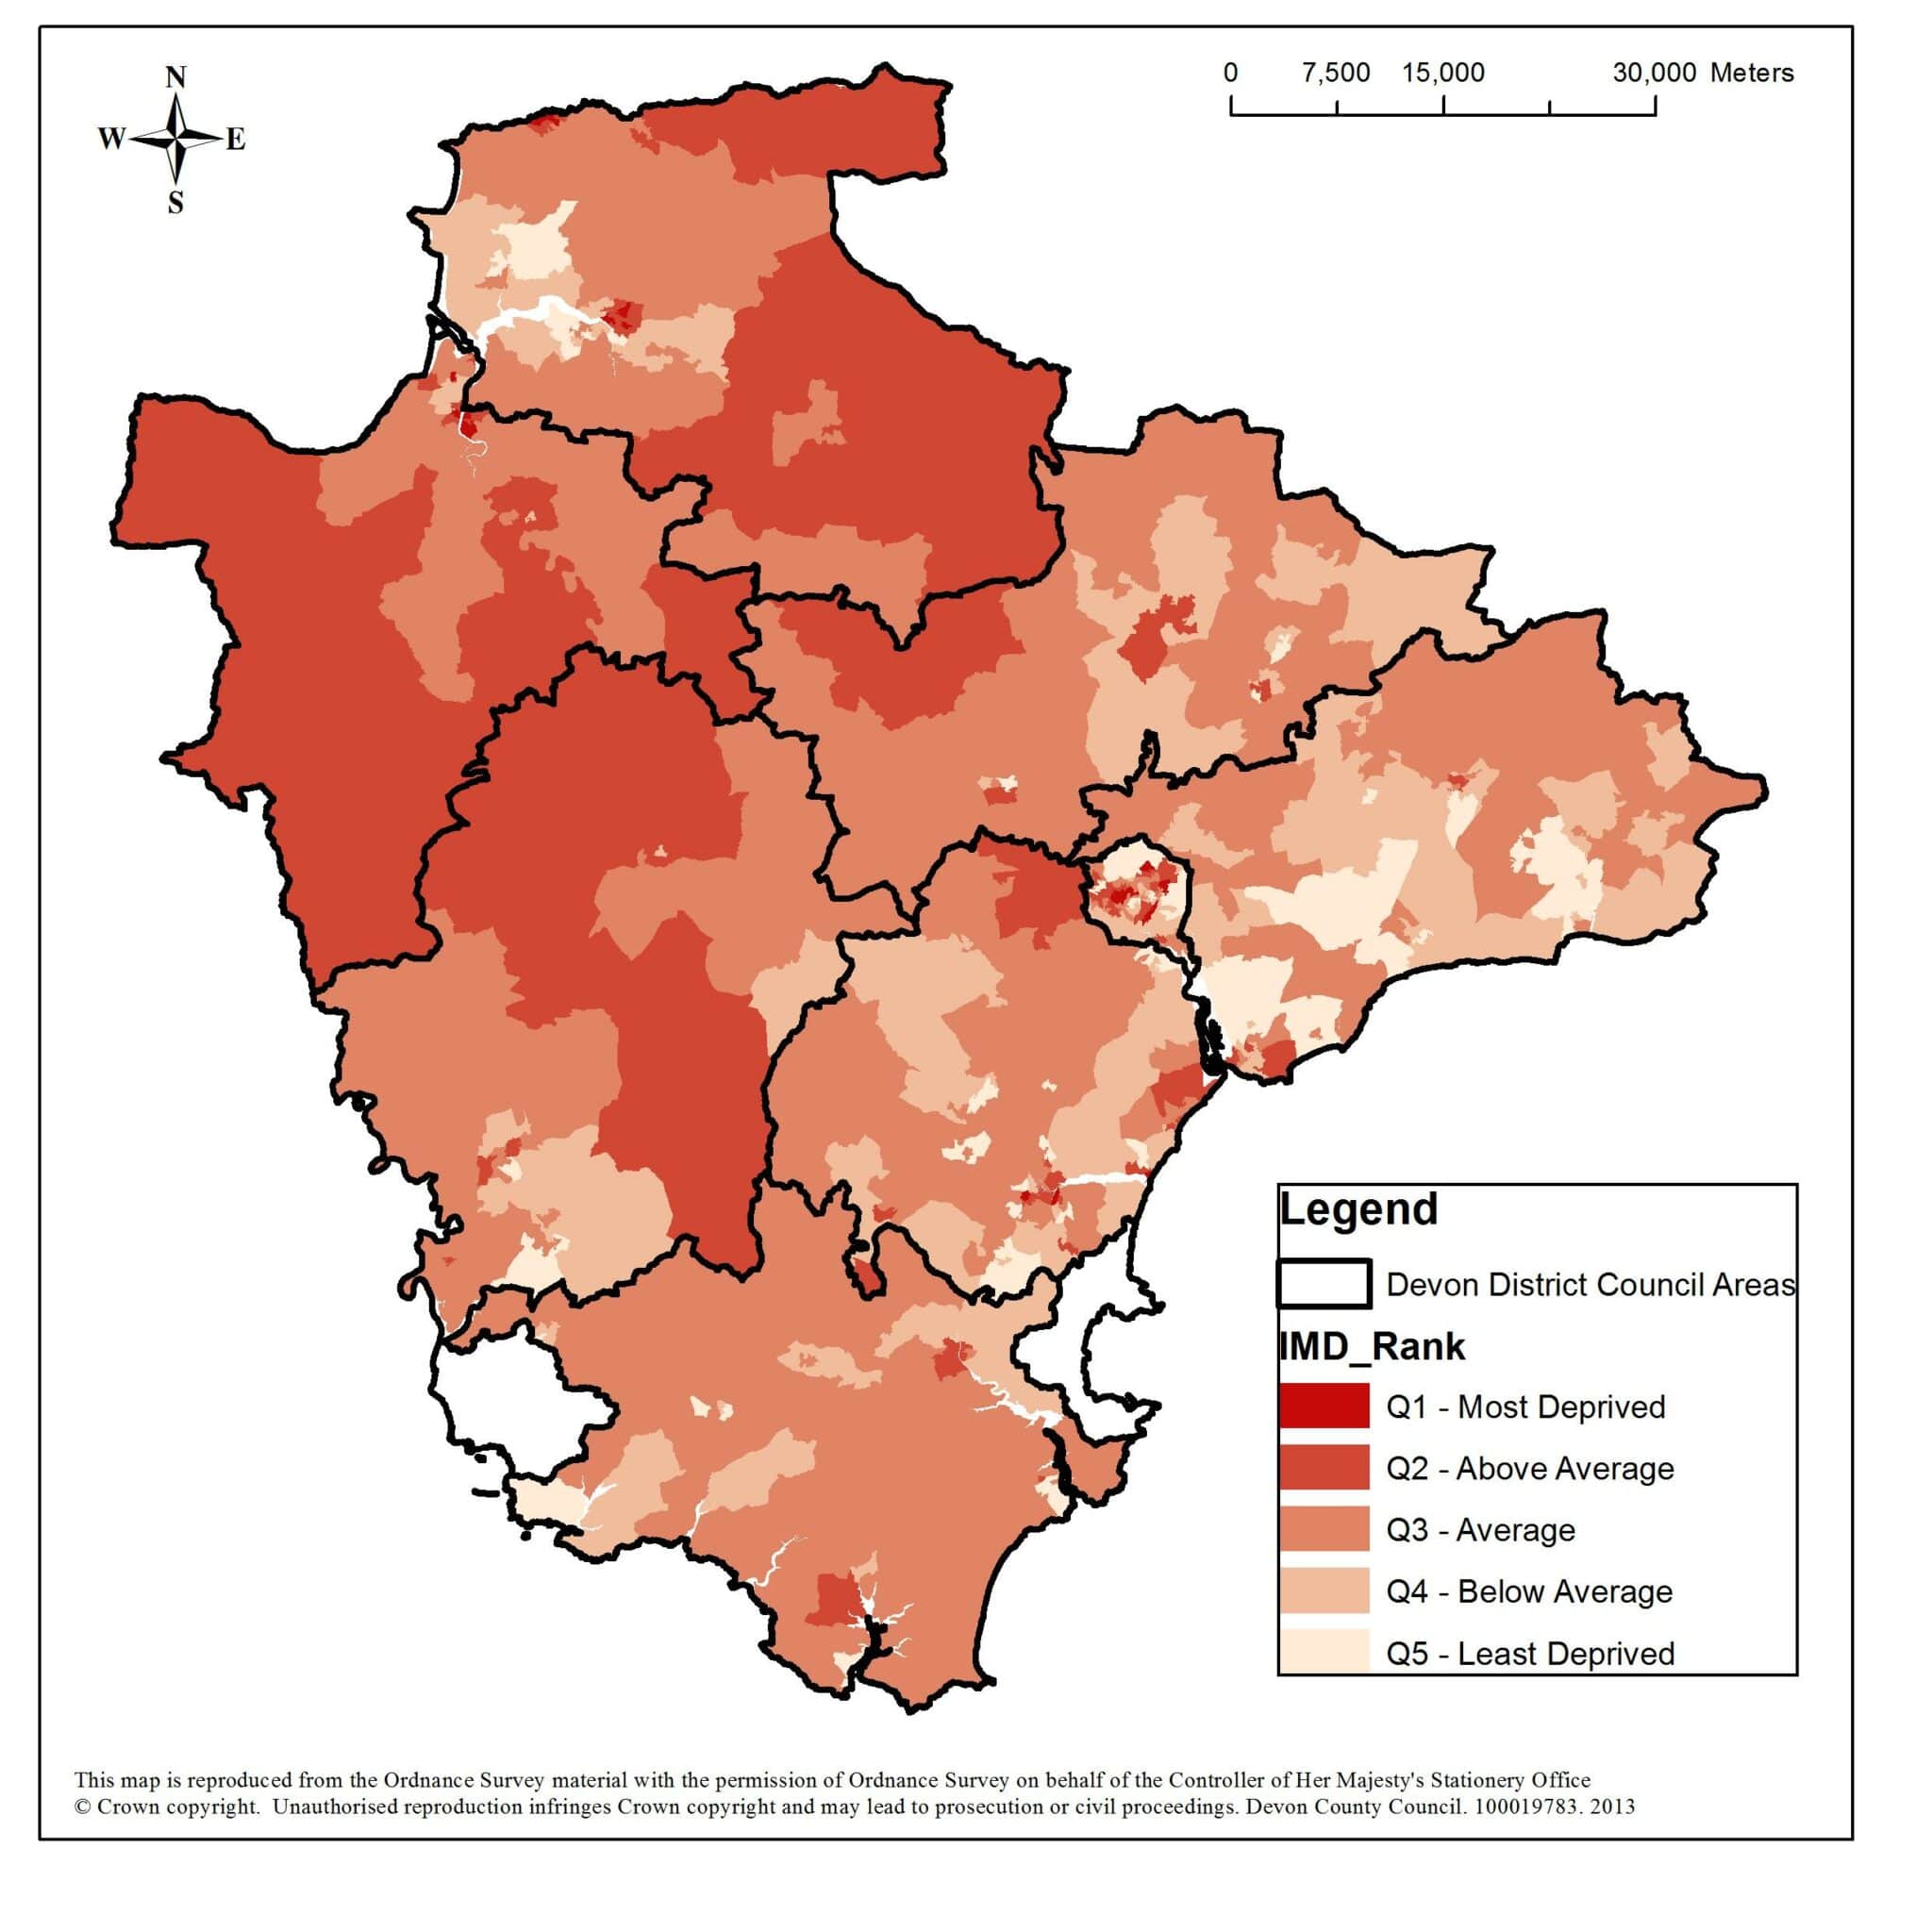
Source: Indices of Deprivation 2010, Department for Communities and Local Government
Figure 7.2, Index of Multiple Deprivation 2015 Score by area and urban/rural classification
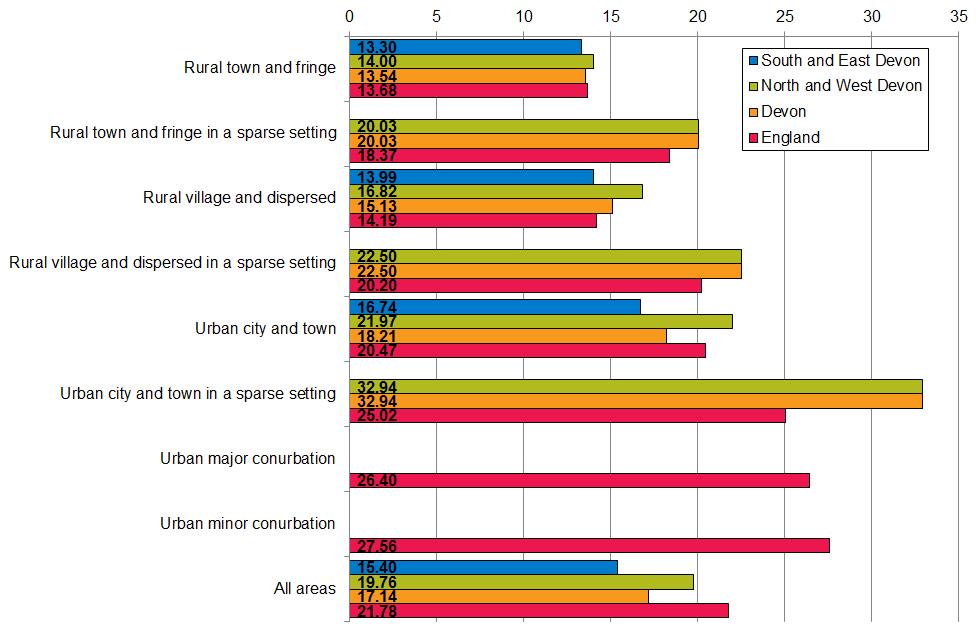
Source: Indices of Deprivation 2015/Urban and Rural Classification 2011, Department for Communities and Local Government
Figure 7.3, Percentage of Devon Population in each Indices of Deprivation Quintile by Domain, 2015
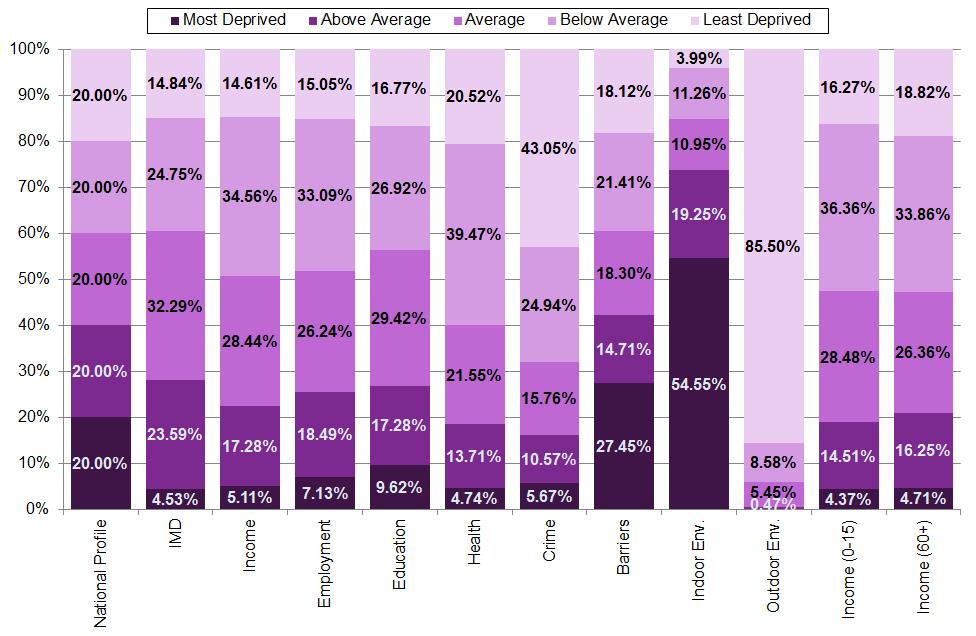
Source: Indices of Deprivation 2015, Department for Communities and Local Government
Figures 7.4 to 7.7, Indices of Deprivation 2015 Intensity Maps showing Devon areas in the most deprived 10%, 25% and 50% nationally: Index of Multiple Deprivation, Income Domain, Employment Domain and Education, Skills and Training Domain
 |
 |
 |
 |
Source: Indices of Deprivation 2015, Department for Communities and Local Government
Figures 7.8 to 7.11, Indices of Deprivation 2015 Intensity Maps showing Devon areas in the most deprived 10%, 25% and 50% nationally: Health Domain, Crime Domain, Geographic Barriers to Services Sub-Domain and Wider Barriers to Services Sub-Domain
 |
 |
 |
 |
Source: Indices of Deprivation 2015, Department for Communities and Local Government
Figures 7.12 to 7.15, Indices of Deprivation 2015 Intensity Maps showing Devon areas in the most deprived 10%, 25% and 50% nationally: Indoor Environment Sub-Domain, Outdoor Environment Sub-Domain, Income Deprivation Affecting Children Index (IDACI) and Income Deprivation Affecting Older People Index (IDAOPI)
 |
 |
 |
 |
Source: Indices of Deprivation 2015, Department for Communities and Local Government
Table 7.1, Summary of Devon areas in the most deprived 20% nationally in the Index of Multiple Deprivation, 2015
| Code / Link | Description | District | Pop’n | Income Deprived | Smoking | High Risk Alcohol Use | Obesity | Physical Inactivity | Life Expectancy |
| E01020112 | Ilfracombe: High Street and Quay | North Devon | 1,622 | 33.0% | 31.0% | 18.9% | 22.2% | 35.2% | 71.9 |
| E01020094 | Barnstaple Town Centre | North Devon | 1,713 | 31.7% | 30.5% | 18.2% | 21.4% | 38.2% | 77.3 |
| E01020015 | Exeter: Burnthouse Lane (Trees) | Exeter | 1,891 | 32.2% | 33.5% | 18.7% | 21.0% | 30.3% | 79.5 |
| E01019995 | Exeter: Sidwell Street/Clifton Road | Exeter | 1,642 | 28.8% | 33.2% | 17.7% | 19.1% | 33.3% | 74.5 |
| E01020280 | Bideford Town Centre | Torridge | 2,312 | 26.0% | 32.7% | 19.0% | 21.5% | 31.9% | 79.8 |
| E01020111 | Ilfracombe: College Area | North Devon | 1,399 | 25.1% | 30.4% | 18.8% | 22.5% | 36.8% | 77.1 |
| E01020113 | Ilfracombe: Wilder Road/Torrs Park | North Devon | 1,498 | 24.0% | 30.5% | 18.8% | 22.1% | 37.1% | 77.8 |
| E01020014 | Exeter: Rifford Road | Exeter | 1,615 | 24.5% | 32.7% | 18.9% | 21.6% | 32.4% | 79.5 |
| E01020103 | Barnstaple: Forches Avenue Area | North Devon | 1,631 | 29.2% | 32.3% | 18.9% | 22.0% | 32.3% | 79.3 |
| E01020277 | Bideford: Churchill Road | Torridge | 2,063 | 28.0% | 30.6% | 18.9% | 22.3% | 35.8% | 80.0 |
| E01020016 | Exeter: Cathedral/City Centre East | Exeter | 2,137 | 22.6% | 34.7% | 18.5% | 19.2% | 30.4% | 81.4 |
| E01020269 | Teignmouth: Town Centre/Seafront | Teignbridge | 1,850 | 23.9% | 27.2% | 17.8% | 22.9% | 44.4% | 81.5 |
| E01019990 | Exeter: Lancelot Road | Exeter | 1,465 | 24.5% | 32.5% | 18.6% | 21.5% | 32.4% | 85.9 |
| E01020297 | Northam Central | Torridge | 1,527 | 29.0% | 28.7% | 18.6% | 23.4% | 39.4% | 80.0 |
| E01020141 | Barnstaple East: Derby/Gorwell Rd | North Devon | 1,803 | 26.8% | 32.2% | 18.9% | 22.0% | 32.1% | 79.9 |
| E01020211 | Newton Abbot: Buckland | Teignbridge | 1,523 | 28.1% | 32.0% | 18.9% | 21.8% | 32.8% | 79.2 |
| E01020039 | Exeter: Whipton, Leypark Road | Exeter | 1,978 | 24.3% | 31.3% | 18.3% | 21.2% | 35.4% | 82.2 |
| E01020018 | Exeter: City Centre West | Exeter | 2,089 | 17.0% | 34.0% | 17.6% | 18.8% | 31.1% | 81.8 |
| E01020216 | Newton Abbot: Broadlands area | Teignbridge | 1,635 | 22.8% | 32.2% | 18.6% | 21.6% | 33.2% | 78.2 |
| E01020037 | Exeter: Whipton, Hillyfield Road | Exeter | 1,408 | 25.0% | 31.4% | 18.4% | 21.6% | 35.0% | 80.6 |
Source: Indices of Deprivation 2015, Department for Communities and Local Government