Body Mass Index (BMI) is an approximate measure of whether someone is overweight or underweight, calculated by dividing their weight in kilograms by the square of their height in metres. Four broad categories are used; if a person’s BMI is less than 18.5 they are classed as underweight; if a person’s BMI is between 18.5 and 25 they are classed as healthy weight; if a person’s BMI is between 25 and 30 they are classed as overweight; and if a person’s BMI is 30 or above they are classed as obese. A combined category for those with a BMI of over 25 is used within the Public Health Outcomes Framework, known as excess weight. Obesity and excess weight is associated with higher risk of illness and premature death, particularly in relation to heart and circulatory diseases, whilst being underweight can be associated with musculoskeletal problems, a weakened immune system and fatigue. Table 9.2 provides an estimate of the adult population in Devon in these categories. Nationally according to the health survey for England obesity among from 15% in 1993 to 26% in 2010, with higher rates seen in adults aged between 45 and 74. Figure 9.13 highlights the proportion of the population in the excess weight category compared to similar local authorities nationally. This reveals Devon has a significantly lower proportion of the adult population in the excess weight category compared to the local authority comparator group and England.
Table 9.2, Weight status among adults in Devon, 2012
| Weight Category | Estimated rate and 95% confidence interval (in brackets) | Estimated number and range based on 95% confidence interval (in brackets) |
| Underweight (BMI < 18.5) | 0.9% (0.6% to 1.3%) | 5,600 (3,900 to 7,900) |
| Healthy Weight (BMI 18.5-25) | 38.6% (36.9% to 40.2%) | 242,700 (232,400 to 253,100) |
| Overweight (BMI 25-30) | 38.9% (37.3% to 40.6%) | 245,100 (234,700 to 255,400) |
| Obese (BMI 30+) | 21.6% (20.2 to 23.0%) | 136,100 (127,300 to 144,800) |
| Excess Weight (BMI 25+) | 60.6% (58.9% to 62.2%) | 381,100 (370,800 to 391,500) |
Source: Active People Survey, Sport England, 2014
Figure 9.13, Percentage of Adults classified as overweight or obese (BMI 25 or greater), Devon Local Authority Comparator Group, 2012
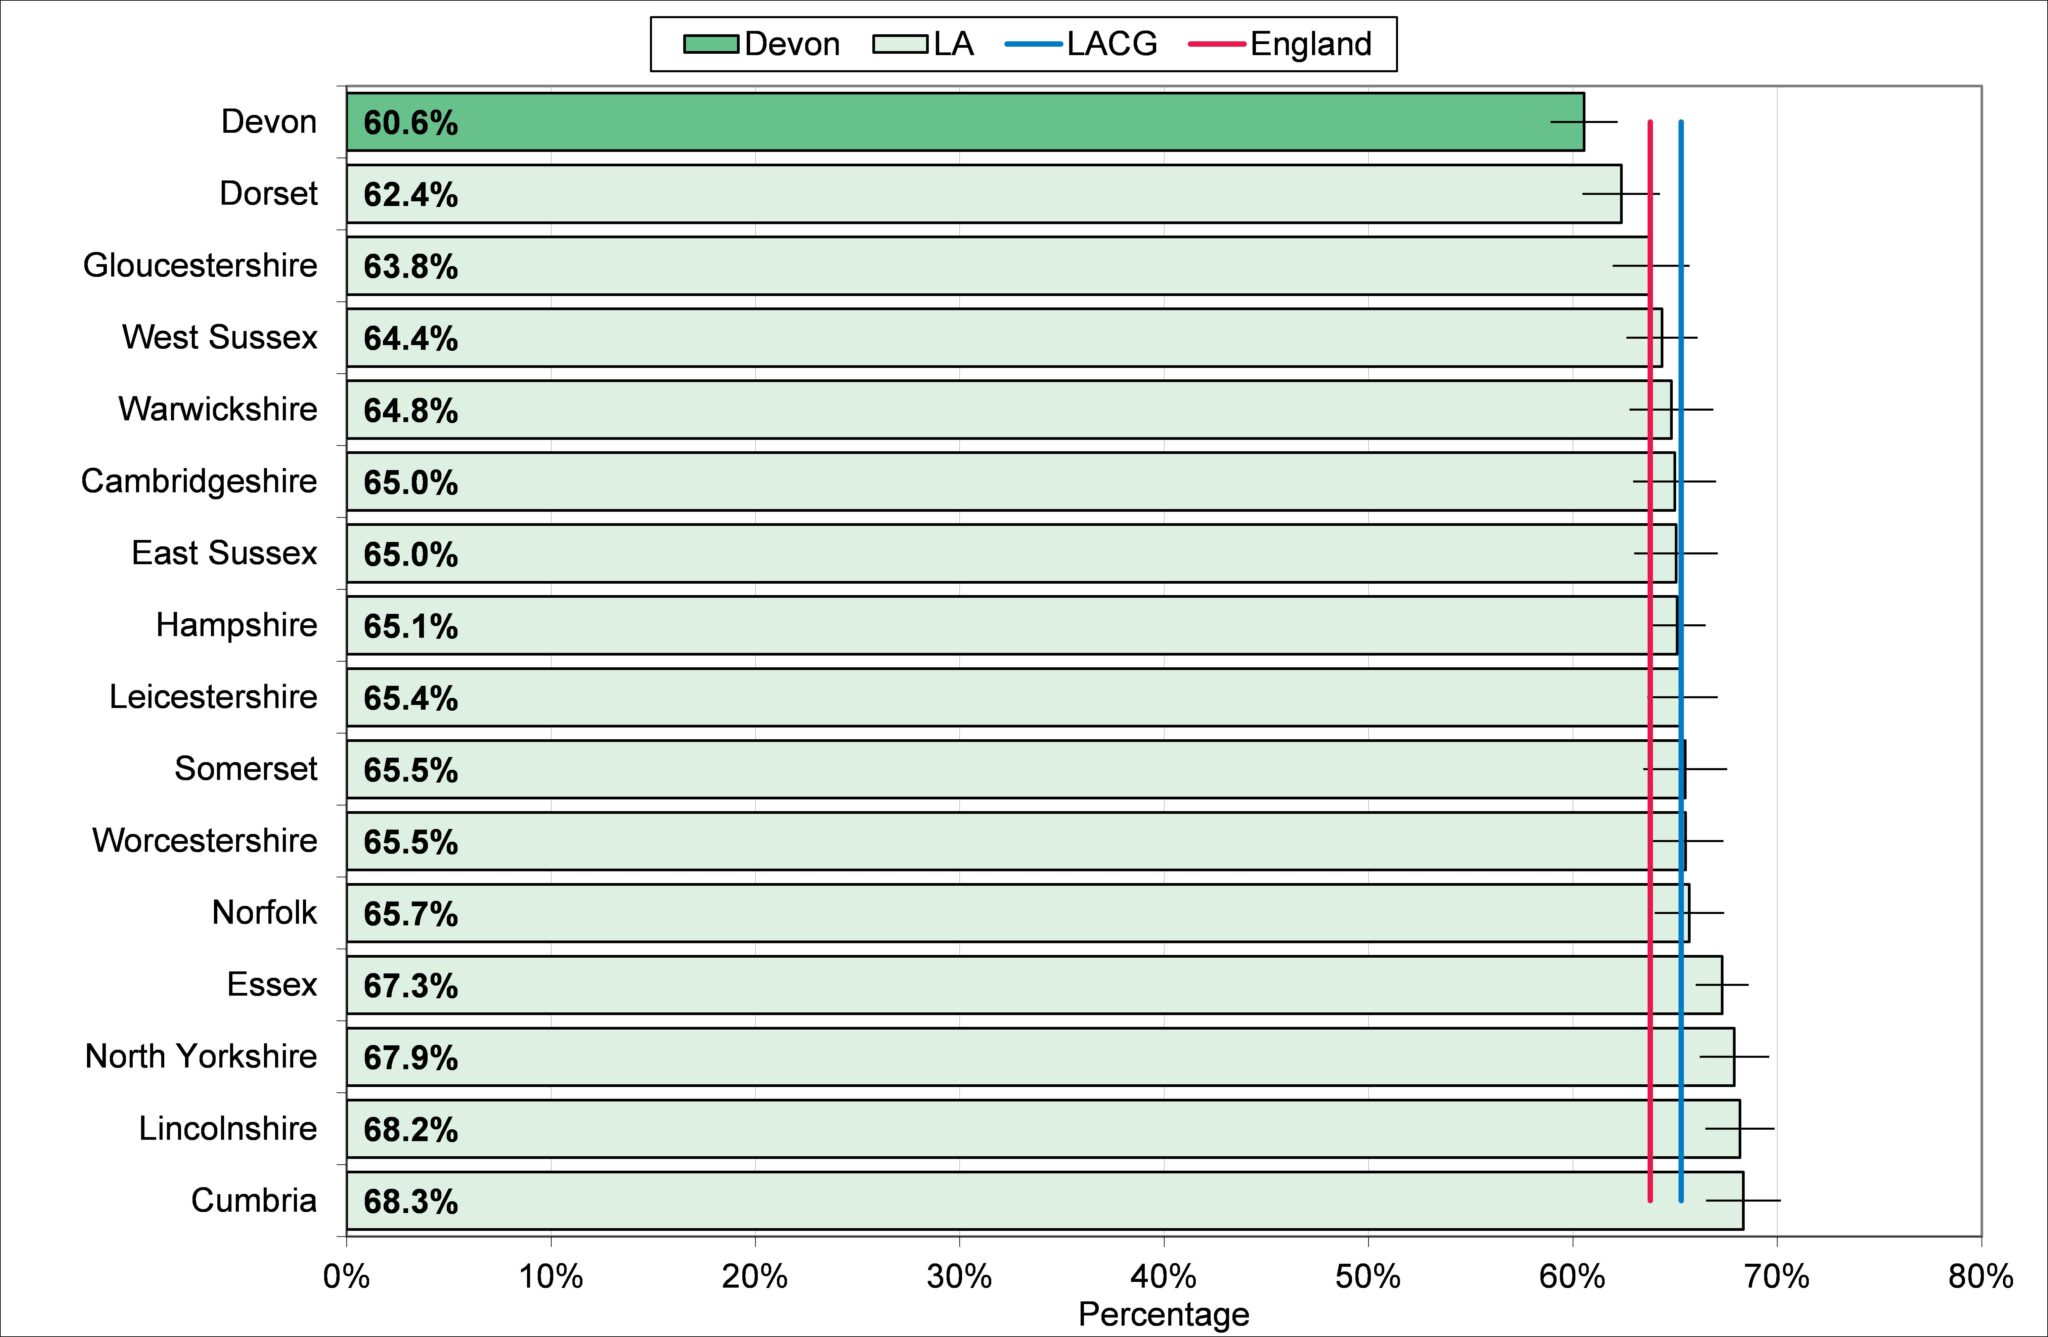
Source: Active People Survey, Sport England, 2014