There are over 5,000 new cases of cancer diagnosed each year in Devon, with around 2,400 deaths due to the condition, representing around just under a third of all deaths. According to the Quality and Outcomes Framework, more than 30,000 are living with a diagnosis of cancer in Devon, Plymouth and Torbay. Figure 9.27 summarises the incidence and mortality figures for different types of cancer in Devon compared to the South West and England, and the trend over time. This reveals whilst the incidence of cancer has increased, due largely to longer life expectancy and improved detection, mortality rates have fallen due to improvements in treatment and long-term care, with many more people living with cancer. The pattern varies by type of cancer, with relatively high levels of malignant melanoma (skin cancer) in the county, and lower levels of lung cancer.
Figure 9.27, New cases (incidence) and deaths (mortality) from selected cancer types, Devon
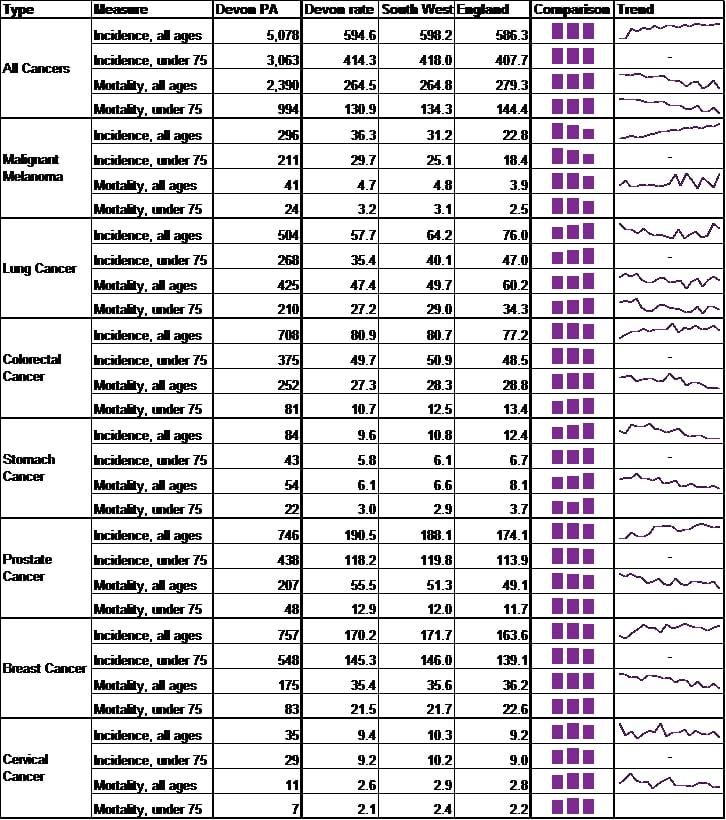
Source: Compendium of Population Health Indicators, Health and Social Care Information Centre, 2015
Incidence = 2010-2012, trend = 1995 to 2012, Mortality = 2011-13, trend = 1995 to 2013
The following figure shows the pattern of cancer incidence and mortality in England by area deprivation using the 2010 Indices of Deprivation. This reveals that for all cancers incidence rates are 18% higher in more deprived areas compared with the least deprived, and mortality rates 53% higher. Considerable variation is seen by cancer type, with a clear relationship between certain cancer types and higher deprivation (lung cancer, stomach cancer and cervical cancer in particular), and some exhibiting a relationship with lower deprivation, such as malignant melanoma. What is clear throughout is health inequalities are always greater in mortality than in incidence rates, highlighting not only is the risk of being diagnosed with cancer is generally greater in more deprived areas, the likelihood of dying for those diagnosed is also higher.
Figure 9.28, Direct Age Standardised Incidence and Mortality rates per 100,000 population for selected cancers by deprivation, England, 2006-10 (incidence) and 2007-11 (mortality)
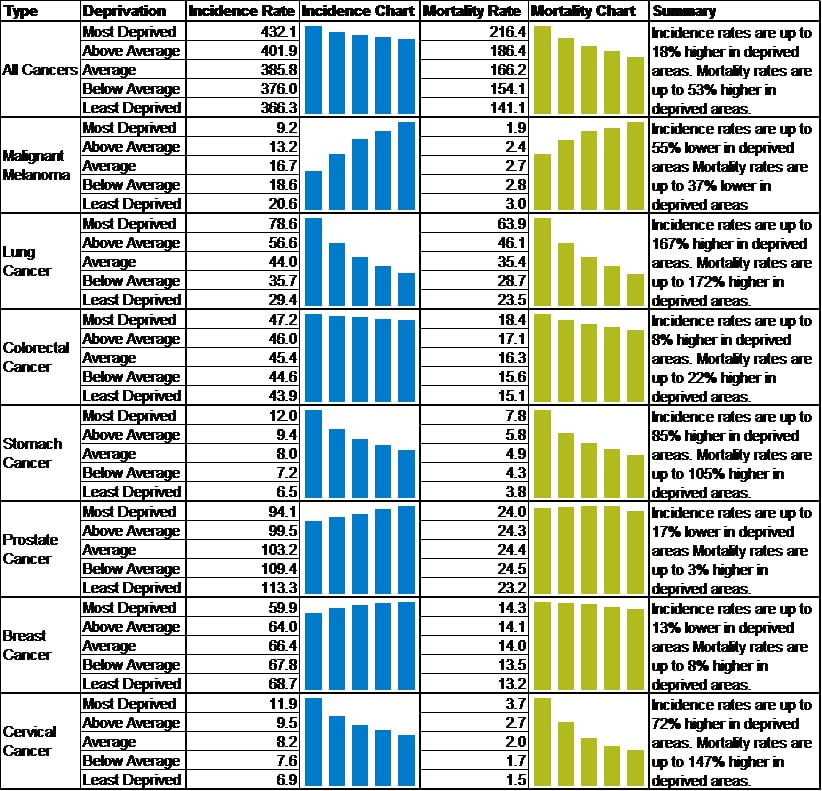
Source: Cancer by Deprivation in England 1996 – 2011, National Cancer Intelligence Network, 2014
Early Detection
Early detection of cancer greatly improves the chances of survival. The NHS Cervical Screening Programme screens more than three million women each year. Cancer Research UK estimates the programme saves more than 4,500 lives in England every year. Screening is used to detect abnormal cells on the cervix. Cervical cancer is one of the few preventable cancers, because screening picks up pre-cancerous changes. Early detection and treatment can prevent up to 75% of cervical cancers. Table 9.11 gives screening coverage by local authority of residence for March 2014. This highlights coverage rates for breast cancer and cervical cancer screening for women in Devon are above the national average.
Table 9.11, Percentage of eligible women screen adequately, March 2014
| Screening Type | Devon | South West | England |
| Breast cancer, aged 53 to 70 | 79.1% | 78.9% | 75.9% |
| Cervical cancer, aged 25 to 64 years | 77.5% | 76.2% | 74.2% |
Source: Health and Social Care Information Centre (Open Exeter), 2014
In 2012, 50.8% of diagnoses for selected cancers were diagnosed at an early stage (one or two). This is above the South West (47.8%), local authority comparator group (49.2%) and England (41.6%) rates. Within Devon the highest rates were seen in North Devon (58.0%) and Teignbridge (56.5%). These are experimental statistics, with poor data quality in some areas meaning data are not available. Differences between areas may relate to better coding and data quality, as well as earlier diagnosis.
Figure 9.29, Proportion of invasive malignancies of breast, prostate, colorectal, lung, bladder, kidney, ovary and uterus, non-Hodgkin lymphomas, and melanomas of skin, diagnosed at stage 1 or 2
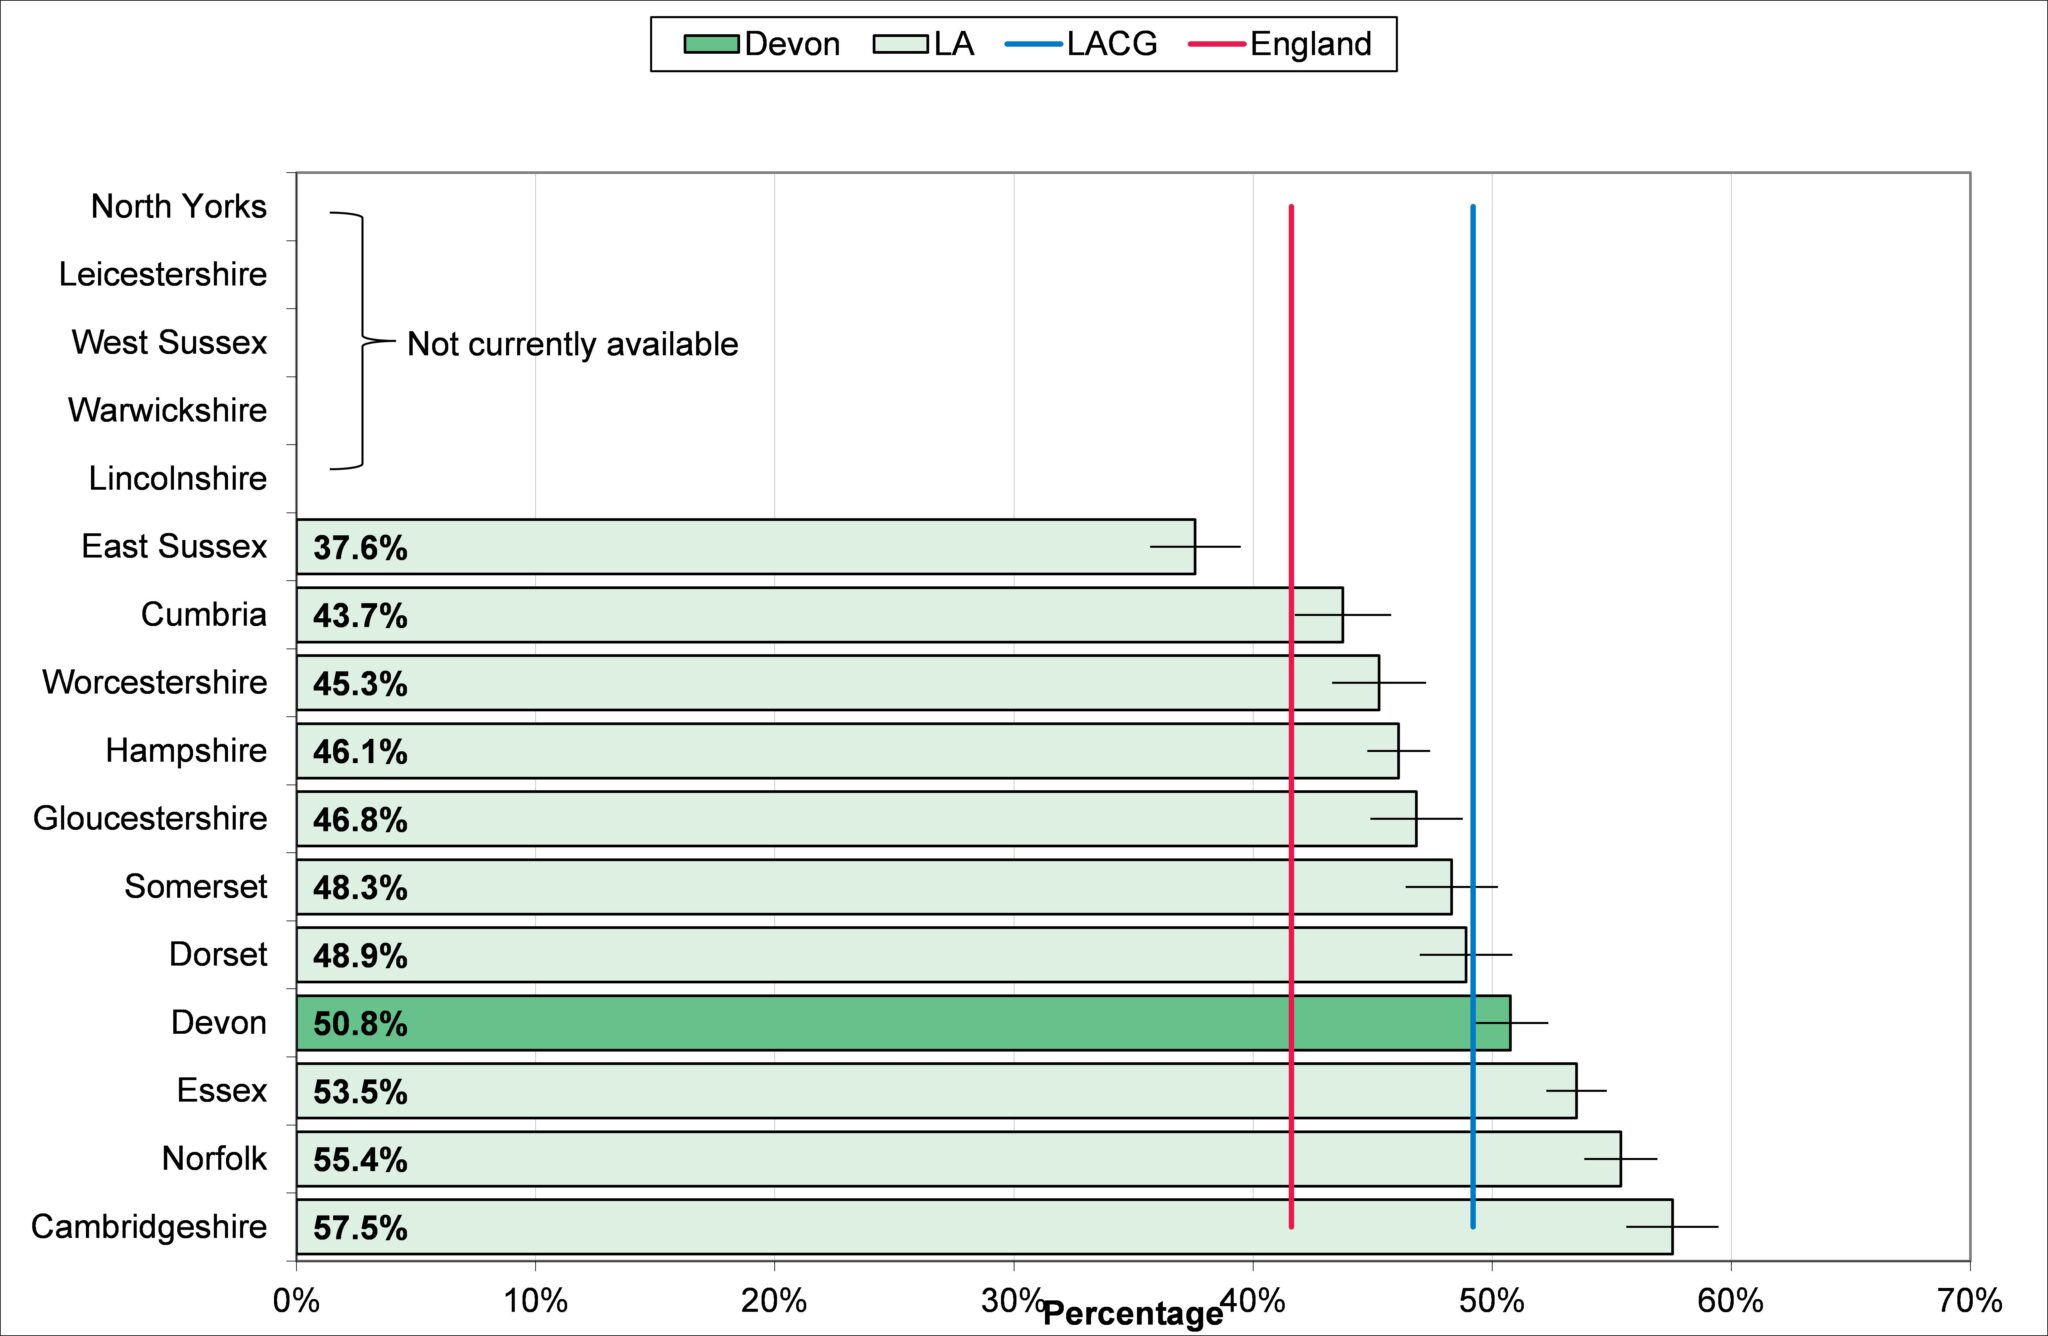
Source: National Cancer Registry, Public Health England, 2014