The number of premises and clubs licensed to sell or supply alcohol by the licensing authorities in Devon are shown in tables 9.4 and 9.5, respectively, with the highest levels seen in North Devon (106 premises per 100,000 population).
Table 9.4, Number of premise licences permitted to sell or supply alcohol by licensable activity, 31st March 2014
| District | On-sale/supply alcohol only | Off-sale alcohol only | On- and off- sale/supply alcohol | Licenses with late night refreshment | Total | Rate per 10,000 population over 18 |
| East Devon | 115 | 121 | 284 | 257 | 777 | 70 |
| Exeter | 66 | 109 | 208 | 232 | 615 | 61 |
| Mid Devon | 53 | 64 | 144 | 124 | 385 | 62 |
| North Devon | 121 | 122 | 343 | 217 | 803 | 106 |
| South Hams | 114 | 95 | 216 | 129 | 554 | 81 |
| Teignbridge | 93 | 114 | 249 | 188 | 644 | 63 |
| Torridge | 51 | 51 | 157 | 76 | 335 | 63 |
| West Devon | 54 | 47 | 138 | 100 | 339 | 77 |
| Devon | 667 | 723 | 1,739 | 1,323 | 4452 | 72 |
Source: Devon Local Authority Districts, 2015
Table 9.5, Number of club premises certificates permitted to sell or supply alcohol by licensable activity, 31st March 2014
| District | On-sale/supply alcohol only | On- and off- sale/supply alcohol | Total | Rate per 10,000 population over 18 |
| East Devon | 22 | 35 | 57 | 5 |
| Exeter | 8 | 20 | 28 | 3 |
| Mid Devon | 10 | 36 | 46 | 7 |
| North Devon | 4 | 34 | 38 | 5 |
| South Hams | 7 | 37 | 44 | 6 |
| Teignbridge | 52 | 10 | 62 | 6 |
| Torridge | 25 | 5 | 30 | 6 |
| West Devon | 3 | 24 | 27 | 6 |
| Devon | 131 | 201 | 332 | 5 |
Source: Devon Local Authority Districts, 2015
Figure 9.15 displays average alcohol consumption by type in the United Kingdom between 1899 and 2013. Great increases in alcohol consumption were seen between the 1960s and 1990s, with increasing consumption of wine, spirits and cider and decreasing consumption of beer. Average consumption peaked in 2004 and has been decreasing ever since.
Figure 9.15, Litres of pure alcohol consumed per person per year by type, United Kingdom, 1899 to 2013
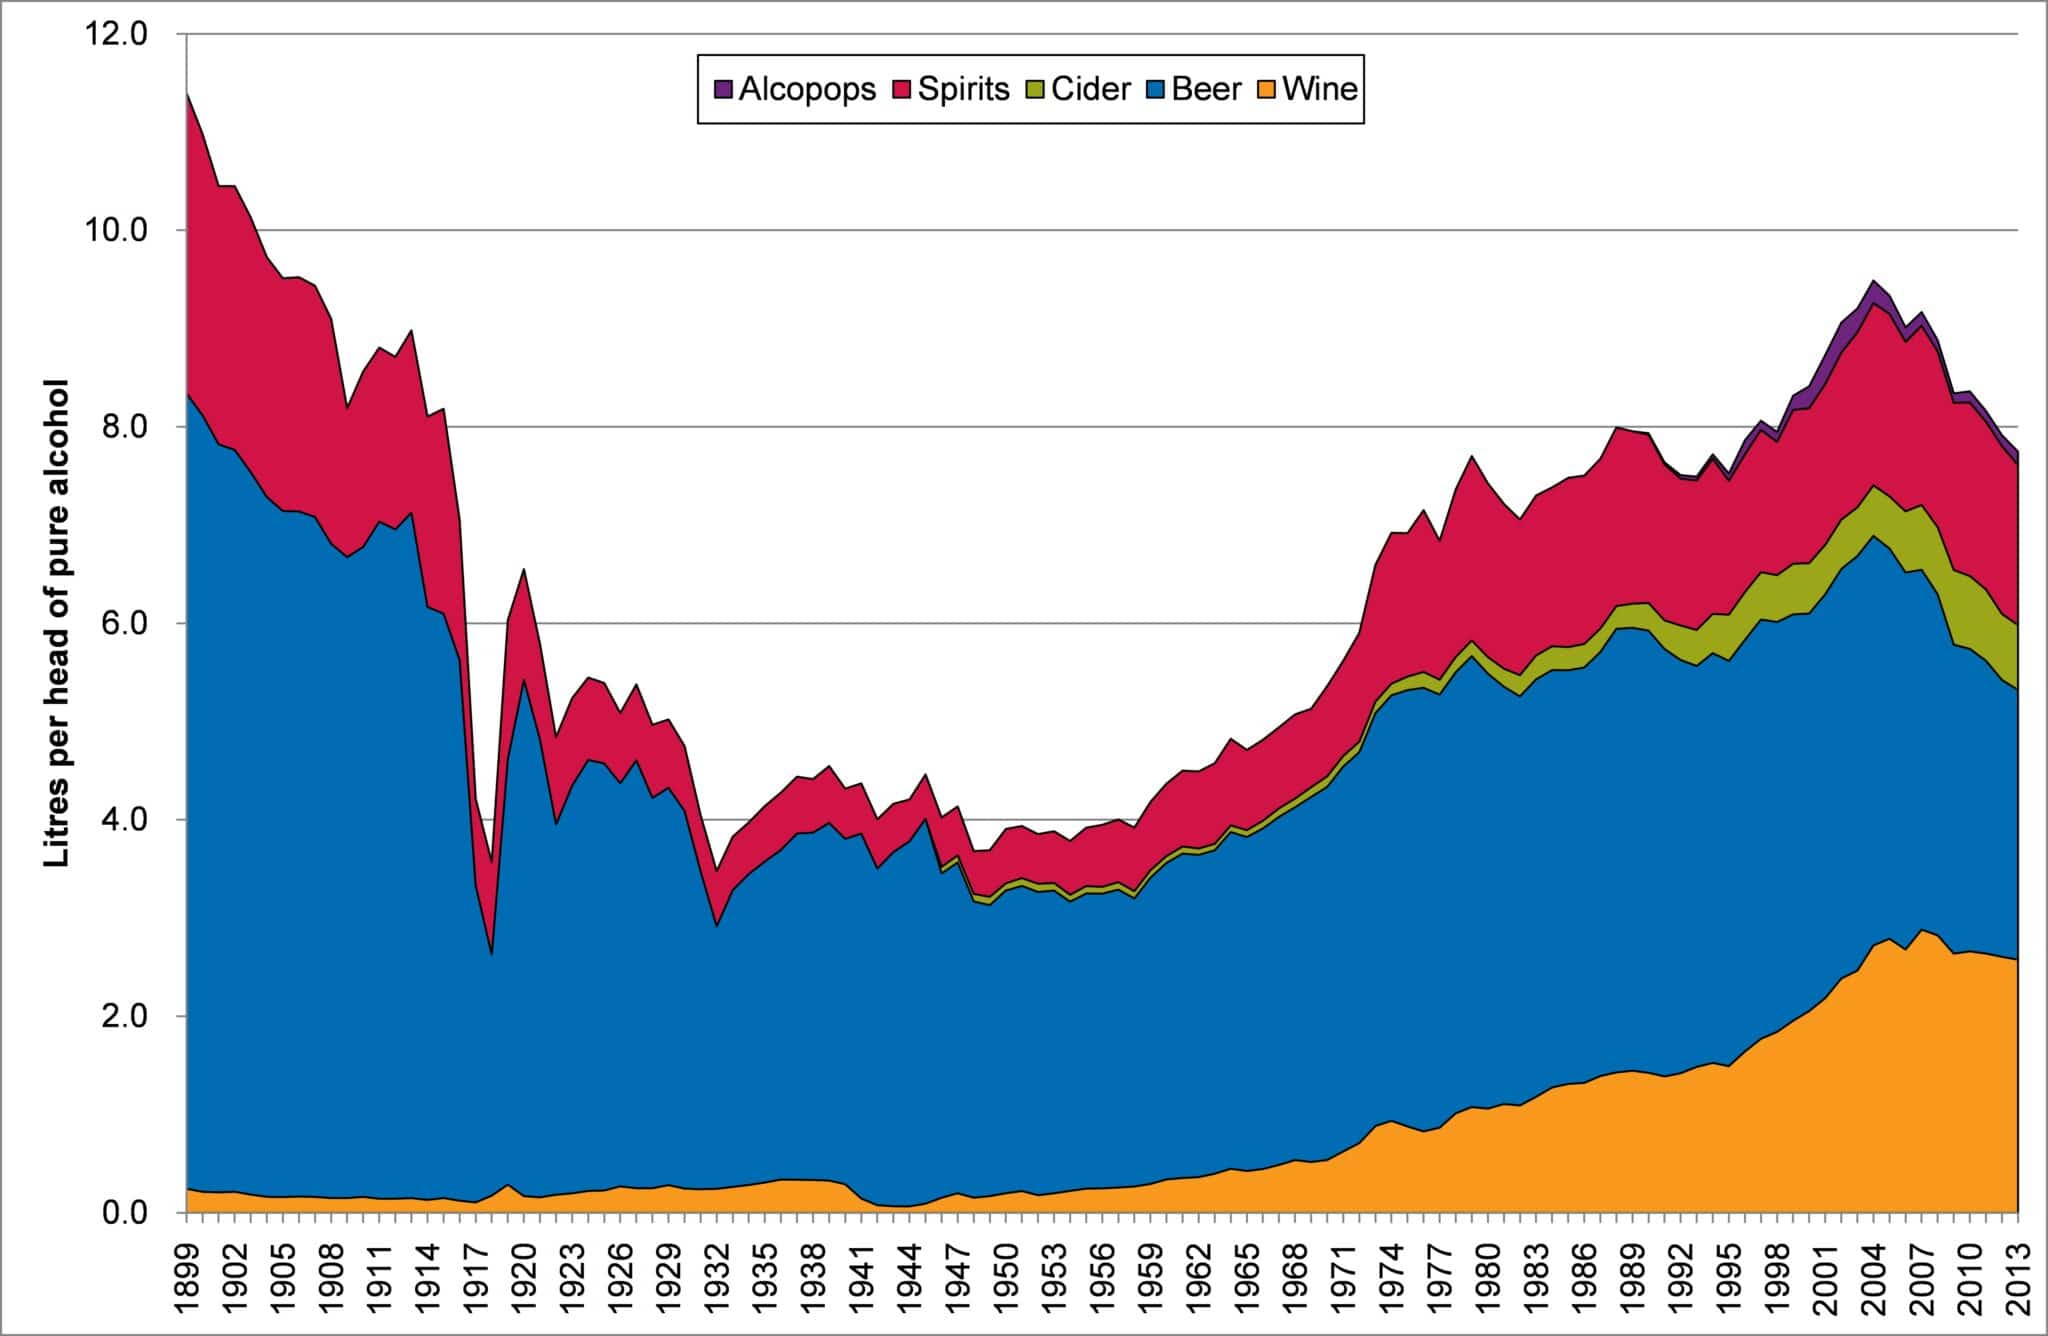
Source: British Beer and Pub Association, 2014
This pattern is being driven by a reduction in the number of young people drinking alcohol, which has fallen nationally from over 60% in 1988 to below 45% in 2012 as illustrated in figure 9.16.
Figure 9.16, Proportion of pupils at age 15 in England who had ever had an alcoholic drink (1988-2012)
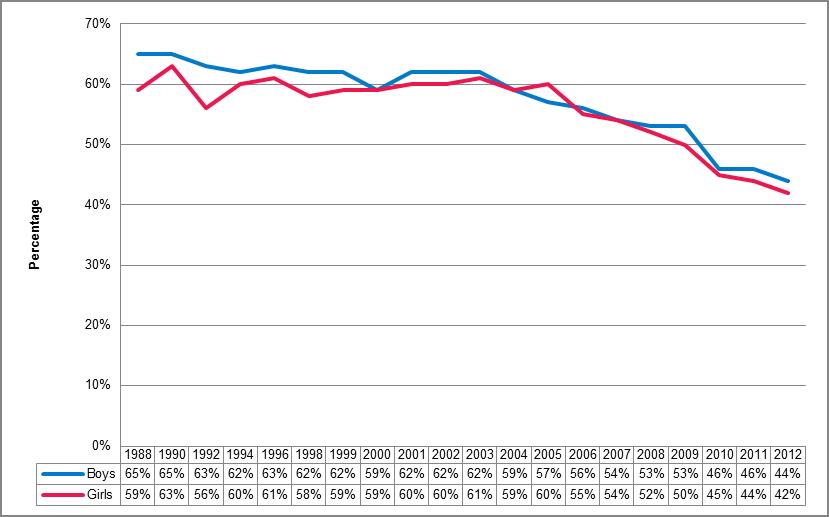
Source: Smoking, Drinking and Drug Use among young people in England in 2012. Health and Social Care Information Centre, 2013
Figure 9.17 reveals the proportion of people binge drinking (men who have consumed more than eight units of alcohol and women more than six units at least once in the past week) has also reduced. This is in all age groups, except those aged 65 years and over, with the greatest reductions seen in the 16 to 24 age group.
Figure 9.17, Binge drinking in men and women by age group, UK, 2005 to 2012
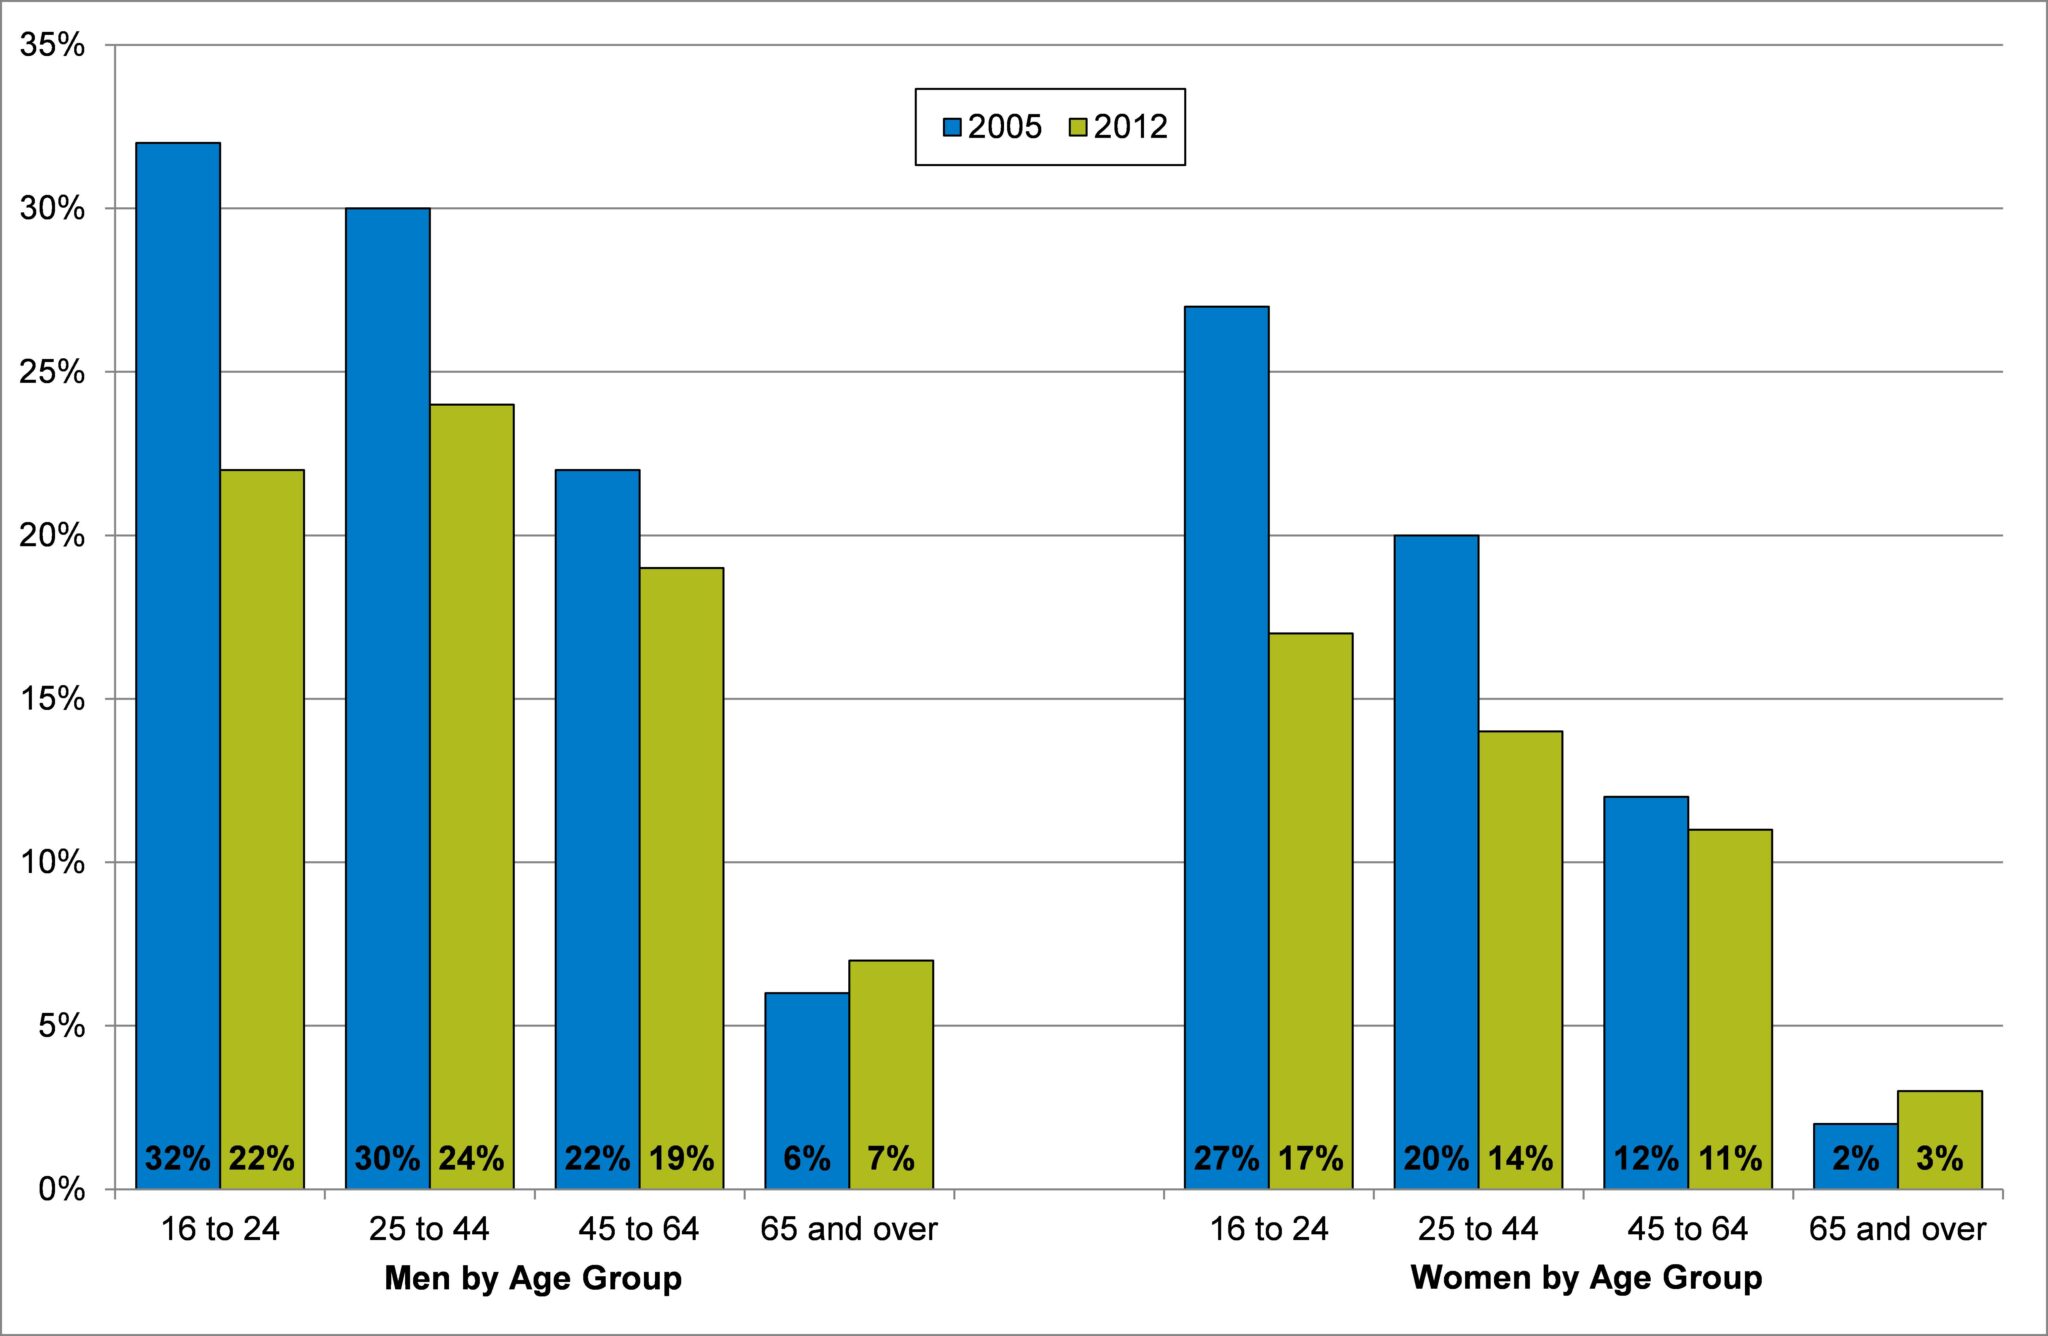
Source: Office for National Statistics Opinions and Lifestyle Survey, 2012
Two related measures of alcohol-related hospital admissions exist. The first is a narrow definition, used in the Public Health Outcomes Framework, which covers admissions where the primary diagnosis was alcohol-related or where there was an alcohol-related external cause including accidents, self-harm and intentional injury. The broad definition also includes admissions where secondary diagnoses were alcohol-related, which captures a wider range of chronic health conditions where alcohol is a contributory factor. The further analyses in this report use the broad definition of alcohol-related hospital admission to better represent the overall impact on alcohol use.
There were around 17,500 admissions to hospital due to alcohol-related conditions in Devon in 2013-14, at a cost of around £30 million. North Devon and Torridge have the highest alcohol-related hospital admission rates, as shown in table 9.6. However, there is considerable variation within local authority districts, with the highest rate within small local areas in Devon (lower super output areas) around 13 times higher than the lowest.
Table 9.6, Overall, highest and lowest alcohol-related admission rates by Devon local authority district, 2011-12 to 2013-14, direct-age standardised rate (DASR) per 100,000
| District | DASR per 100,000 | Area with highest rate | Area with lowest rate | ||
| Name | DASR | Name | DASR | ||
| East Devon | 1277.1 | Honiton King Street area | 2537.9 | Uplyme and Axmouth area | 465.3 |
| Exeter | 1683.6 | Longbrook Street area | 3963.0 | Matford Lane and St Leonards road | 654.5 |
| Mid Devon | 1234.7 | Tiverton: The Avenue area | 2135.1 | Clayhanger and surrounding areas | 634.5 |
| North Devon | 2064.2 | Barnstaple Town Centre | 6061.3 | Woolacombe and surrounding areas | 1136.6 |
| South Hams | 1568.2 | Ivybridge Central | 2965.8 | Dittisham and surrounding areas | 971.8 |
| Teignbridge | 1569.3 | Newton Abbot: Windsor Avenue, Buckland | 3247.3 | Combeinteignhead and surrounding areas | 740.8 |
| Torridge | 1950.5 | South East Bideford | 4465.8 | Clawton and surrounding areas | 1006.4 |
| West Devon | 1512.3 | Tavistock East | 2979.2 | Beaworthy and surrounding areas | 849.5 |
| Devon | 1582.5 | Barnstaple Town Centre | 6061.3 | Uplyme and Axmouth area | 465.3 |
Source: Secondary Uses Service, Commissioning Dataset (Inpatient), 2014
Chronic long-term conditions make up the largest group of alcohol-related hospital admissions accounting for 13,061 admissions (74.6%), with mental illness the next biggest group (3,256 admissions, 18.6%), and acute conditions the smallest group (1,187 admissions, 6.8%), as shown in figure 9.18.
Figure 9.18, Number of alcohol-related admissions by condition type
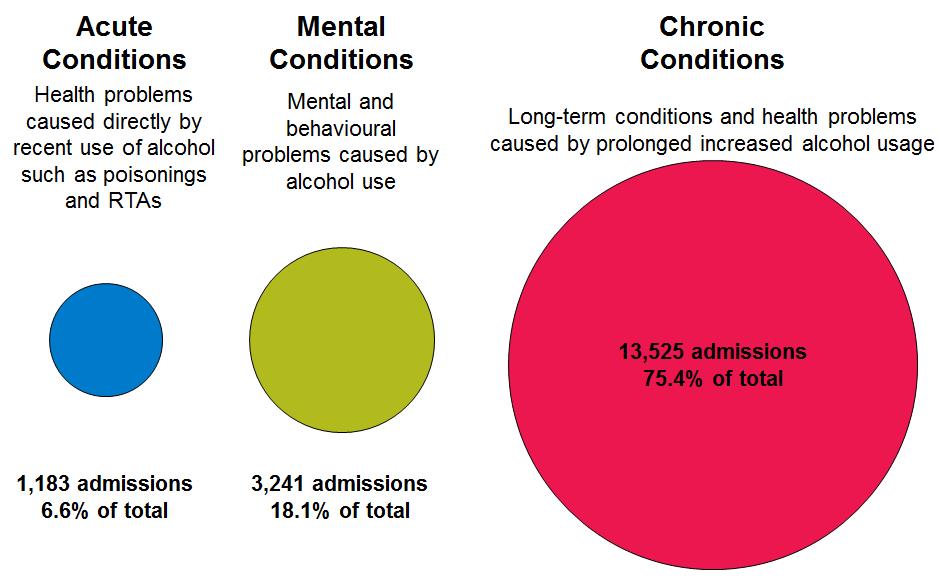
Source: Secondary Uses Service, Commissioning Dataset (Inpatient), 2014
Acute risks to health, such as injury and poisoning occur more frequently in younger age groups, with admissions for alcohol-related mental health conditions peaking in the 40s, 50s and 60s, and chronic long-term health conditions increasing in later life (figure 9.19). The ageing population in Devon will lead to considerable growth in both chronic and mental conditions.
Figure 9.19, Alcohol-related hospital admissions by age and type, 2013-14

Source: Secondary Uses Service, Commissioning Dataset (Inpatient), 2014
Adults living in affluent areas consume more alcohol. The 2011 General Lifestyle Survey households on higher incomes are more likely to have drunk alcohol in the last week and to have done so on five or more days. However, adverse effects of alcohol disproportionally affect those living in areas with higher deprivation, with people living in the most deprived areas are around two and a half times more likely to be admitted for an alcohol-related condition or die from an alcohol-related cause than those in the least deprived areas.