Just over one in 10 households in Devon are in fuel poverty (10.26%), which is above the South West (9.39%) and local authority comparator group (9.24%) rates but below the England (10.41%) rates. The relationship with similar local authorities is shown in figure 10.7. Within Devon the highest levels of fuel poverty were seen in West Devon (11.63%) and the lowest were seen in East Devon (9.14%) as revealed in figure 10.8. Levels of fuel poverty increased between 2011 and 2012 in Devon but fell in many other areas of the country. Fuel poverty in more common in groups with lower household incomes including pensioners, persons on benefits, and working families with below average earnings. The low wage economy, particularly in North and West Devon and higher living costs contribute to levels of fuel poverty locally.
Figure 10.7, Percentage of households that experience fuel poverty based on the ‘Low income, high cost’ methodology, Devon Local Authority Comparator Group, 2012

Source: Department of Energy and Climate Change (DECC), 2014
Figure 10.8, Percentage of households that experience fuel poverty based on the ‘Low income, high cost’ methodology, Devon Local Authority Districts, 2012
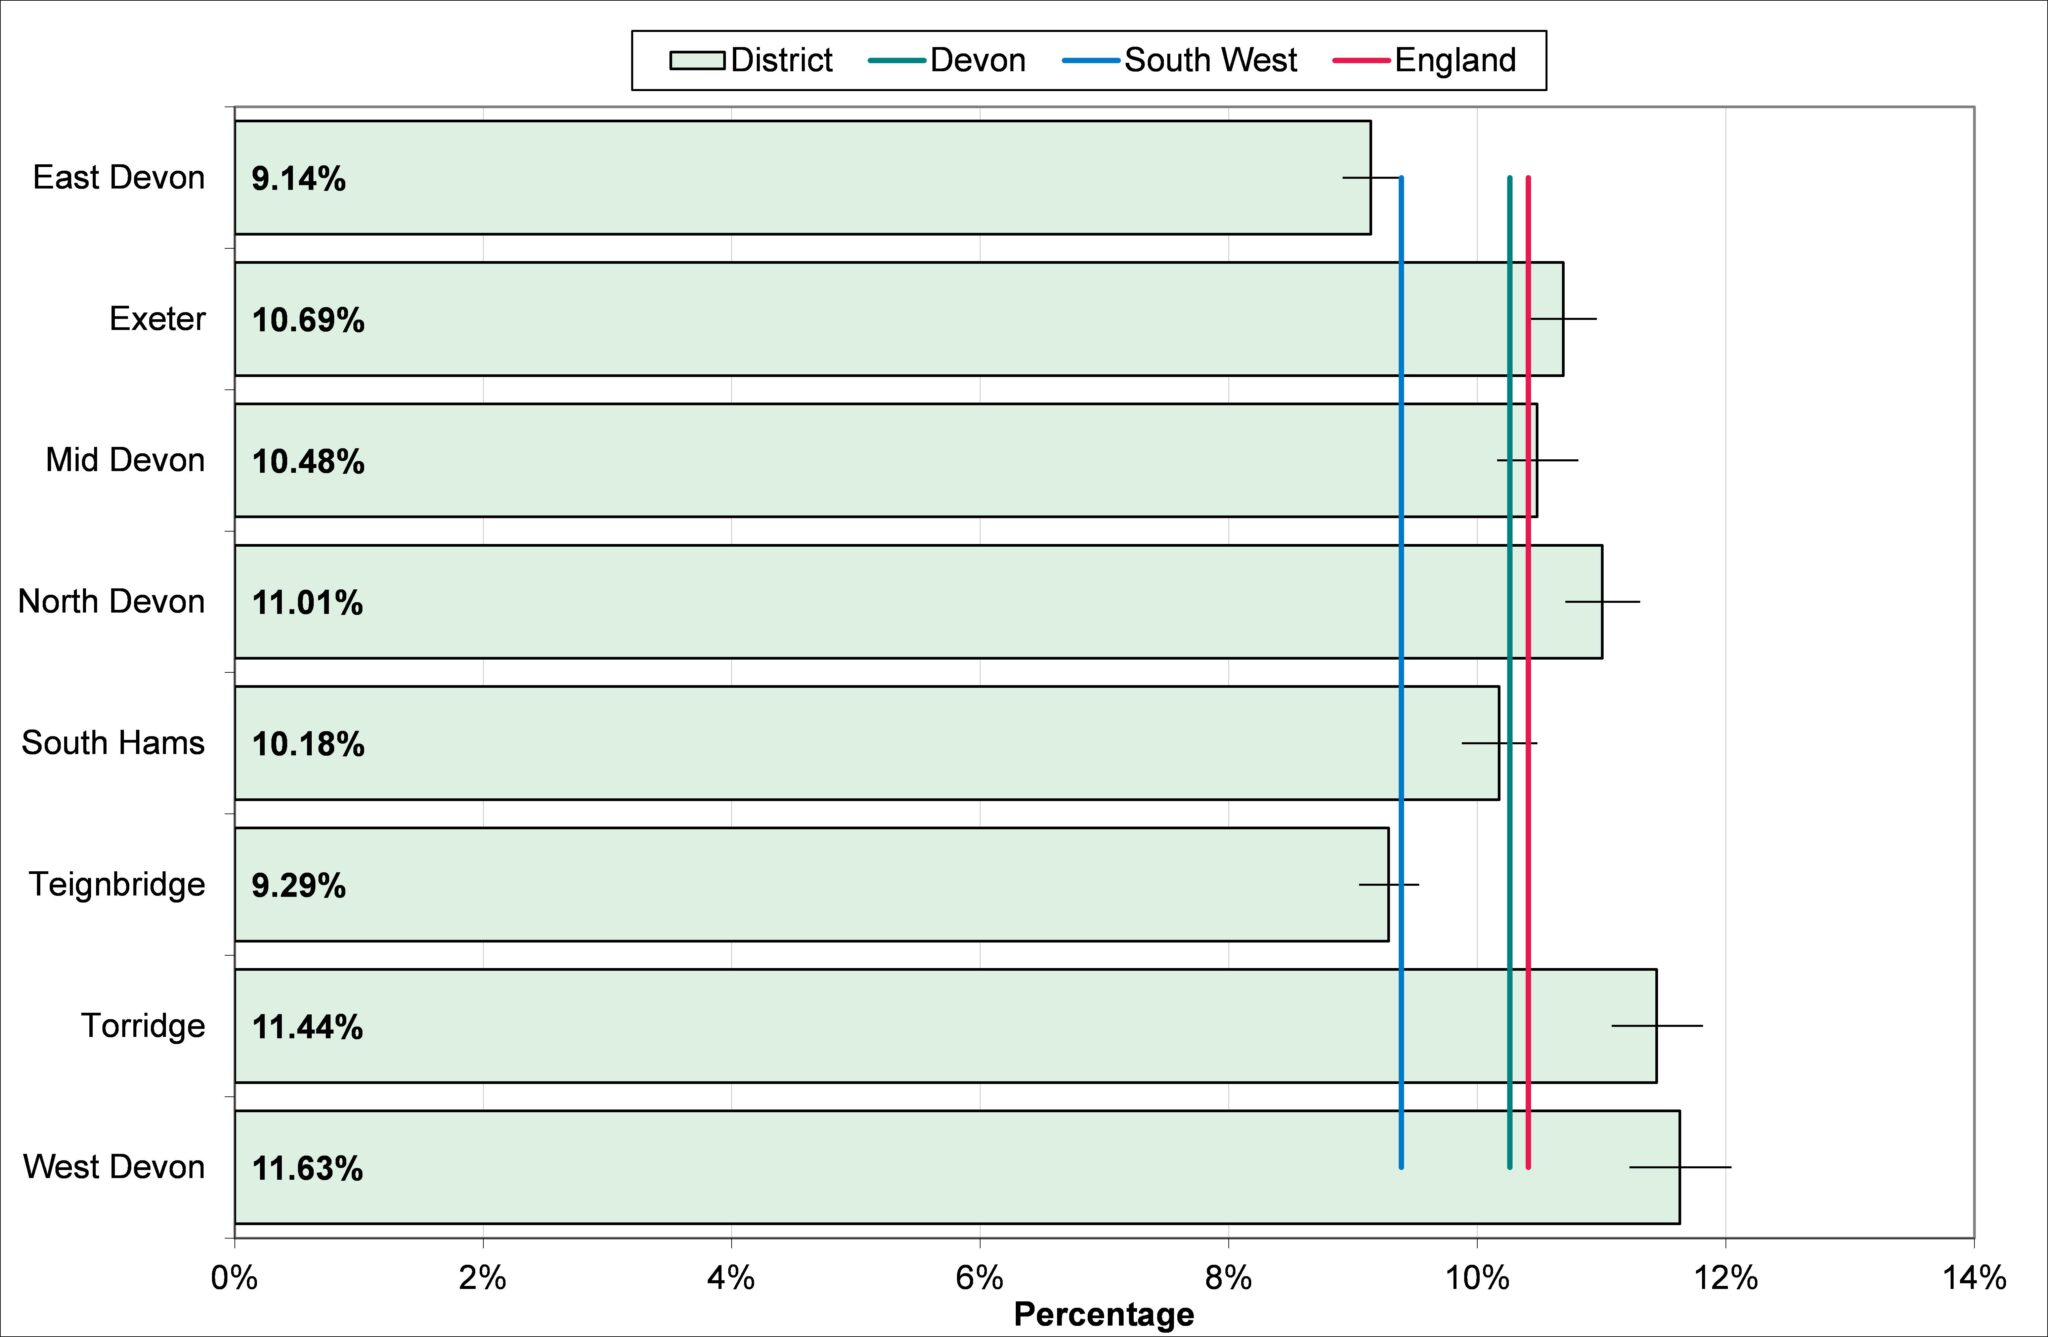
Source: Department of Energy and Climate Change (DECC), 2014