Frailty is not an inevitable consequence of ageing. Many people live to an advanced age while maintaining physical and cognitive function, functional independence and a full and active life, with ill health and disability compressed into a relatively short period before death. However, in a proportion of people, the normal gradual age-related decline in multiple body systems is accelerated, resulting in limited functional reserve, so that even a relatively minor illness or event has a substantial impact on health. This increased vulnerability is termed frailty.
An increased risk of adverse health outcomes can be predicted by early identification of frailty, and adverse outcomes prevented by appropriate multidisciplinary interventions. Frailty in older people negatively impacts on their quality of life and causes ill-health and premature mortality. Older people who are frail have an increased risk of falls, disability, long-term care and death.
Using a methodology developed by Collard et al in 2012 (Collard et al, 2012. Prevalence of frailty in community-dwelling older persons: A systematic review. J Am Geriatr Soc; 60: pp1487-92), it is estimated that approximately 11% of over 65 year olds are frail, defined as having three or more symptoms from weight loss, self-reported exhaustion, low energy expenditure, slow gait speed and weak grip strength. About 42% of over 65 year olds have one or two of these symptoms and are categorised as pre-frail.
This equates to 2.51% (19,001 people) of the Devon population who are frail and 9.97% (75,546 people) who are pre-frail as shown in figure 10.2 and table 10.2 below.
Figure 10.2, Estimated percentage of total population who are frail or pre-frail and aged 65 and over
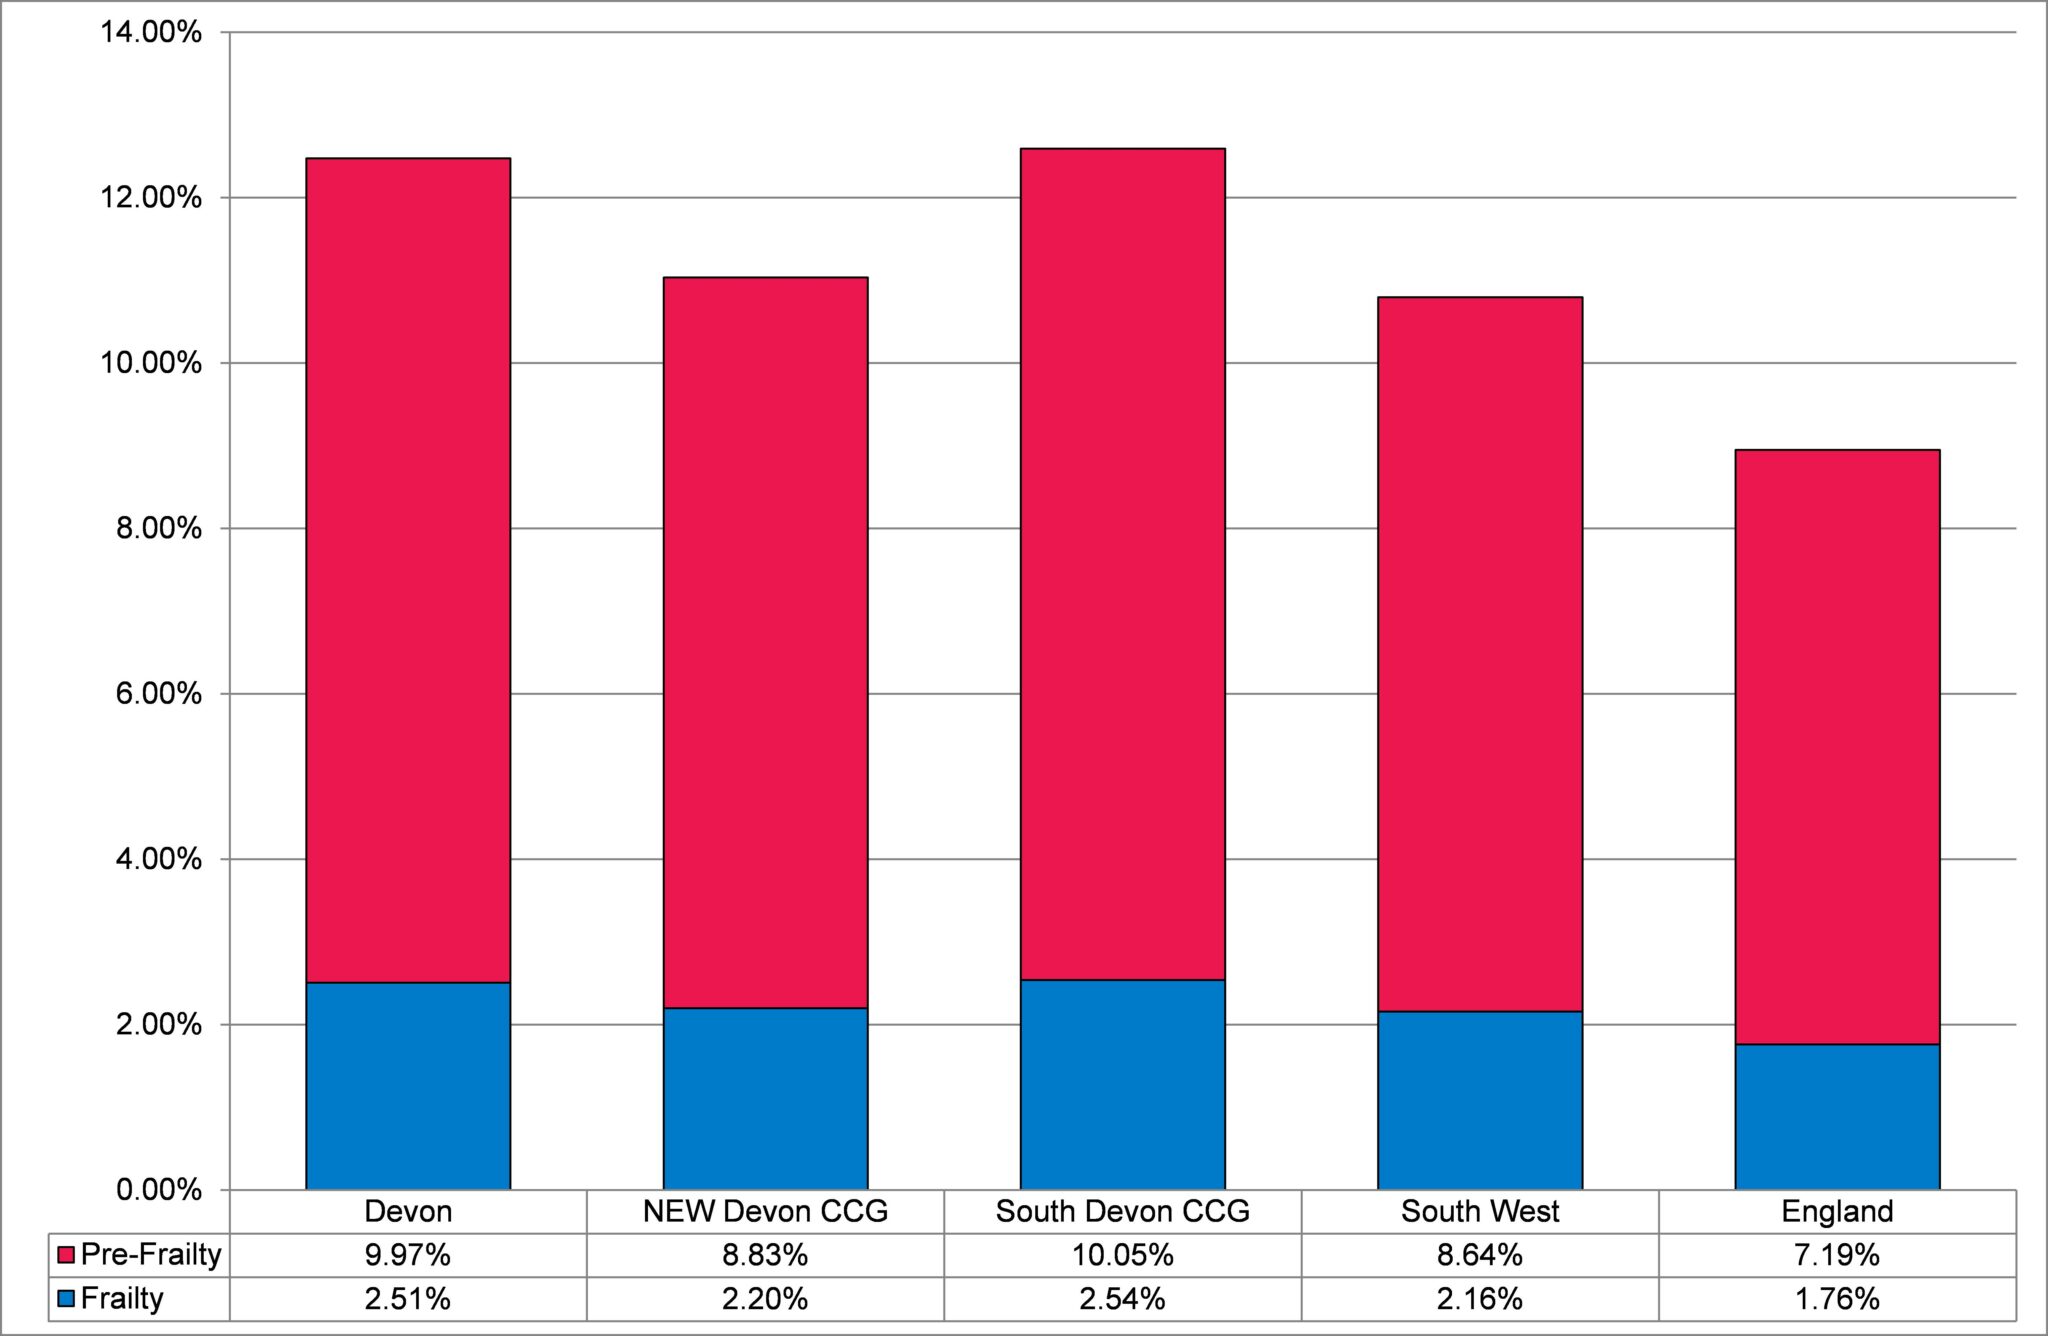
Source: Office for National Statistics Mid-Year Population Estimates, 2013 / Collard et al 2012
Table 10.2, Older People Frail Estimates, Devon, 2013
| Age Group | Reported Frailty Rate | Reported Pre-Frailty Rate | Population | Estimated Frailty | Estimated Pre-Frailty |
| 65 and over | – | 41.6% | 181,600 | 19,001 | 75,546 |
| 65 to 69 | 4.0% | – | 56,422 | 2,257 | – |
| 70 to 74 | 7.0% | – | 40,334 | 2,823 | – |
| 75 to 79 | 9.0% | – | 32,639 | 2,938 | – |
| 80 to 84 | 15.7% | – | 25,408 | 3,989 | – |
| 85 and over | 26.1% | – | 26,797 | 6,994 | – |
Source: Office for National Statistics Mid-Year Population Estimates, 2013 / Collard et al 2012
As these estimates focus on older people over 65 years of age with either frailty or pre-frailty, it is important to note that these are likely to be underestimates, as a proportion of the under 65 year old population will meet the criteria for frailty and pre-frailty.
Figure 10.3 reveals how the number of older people who are frail is predicted to rise over the next 25 years, increasing from 16,042 in 2012 to 26,627 in 2037.
Figure 10.3, Frailty Projections by Age Group, Devon, 2012 to 2037
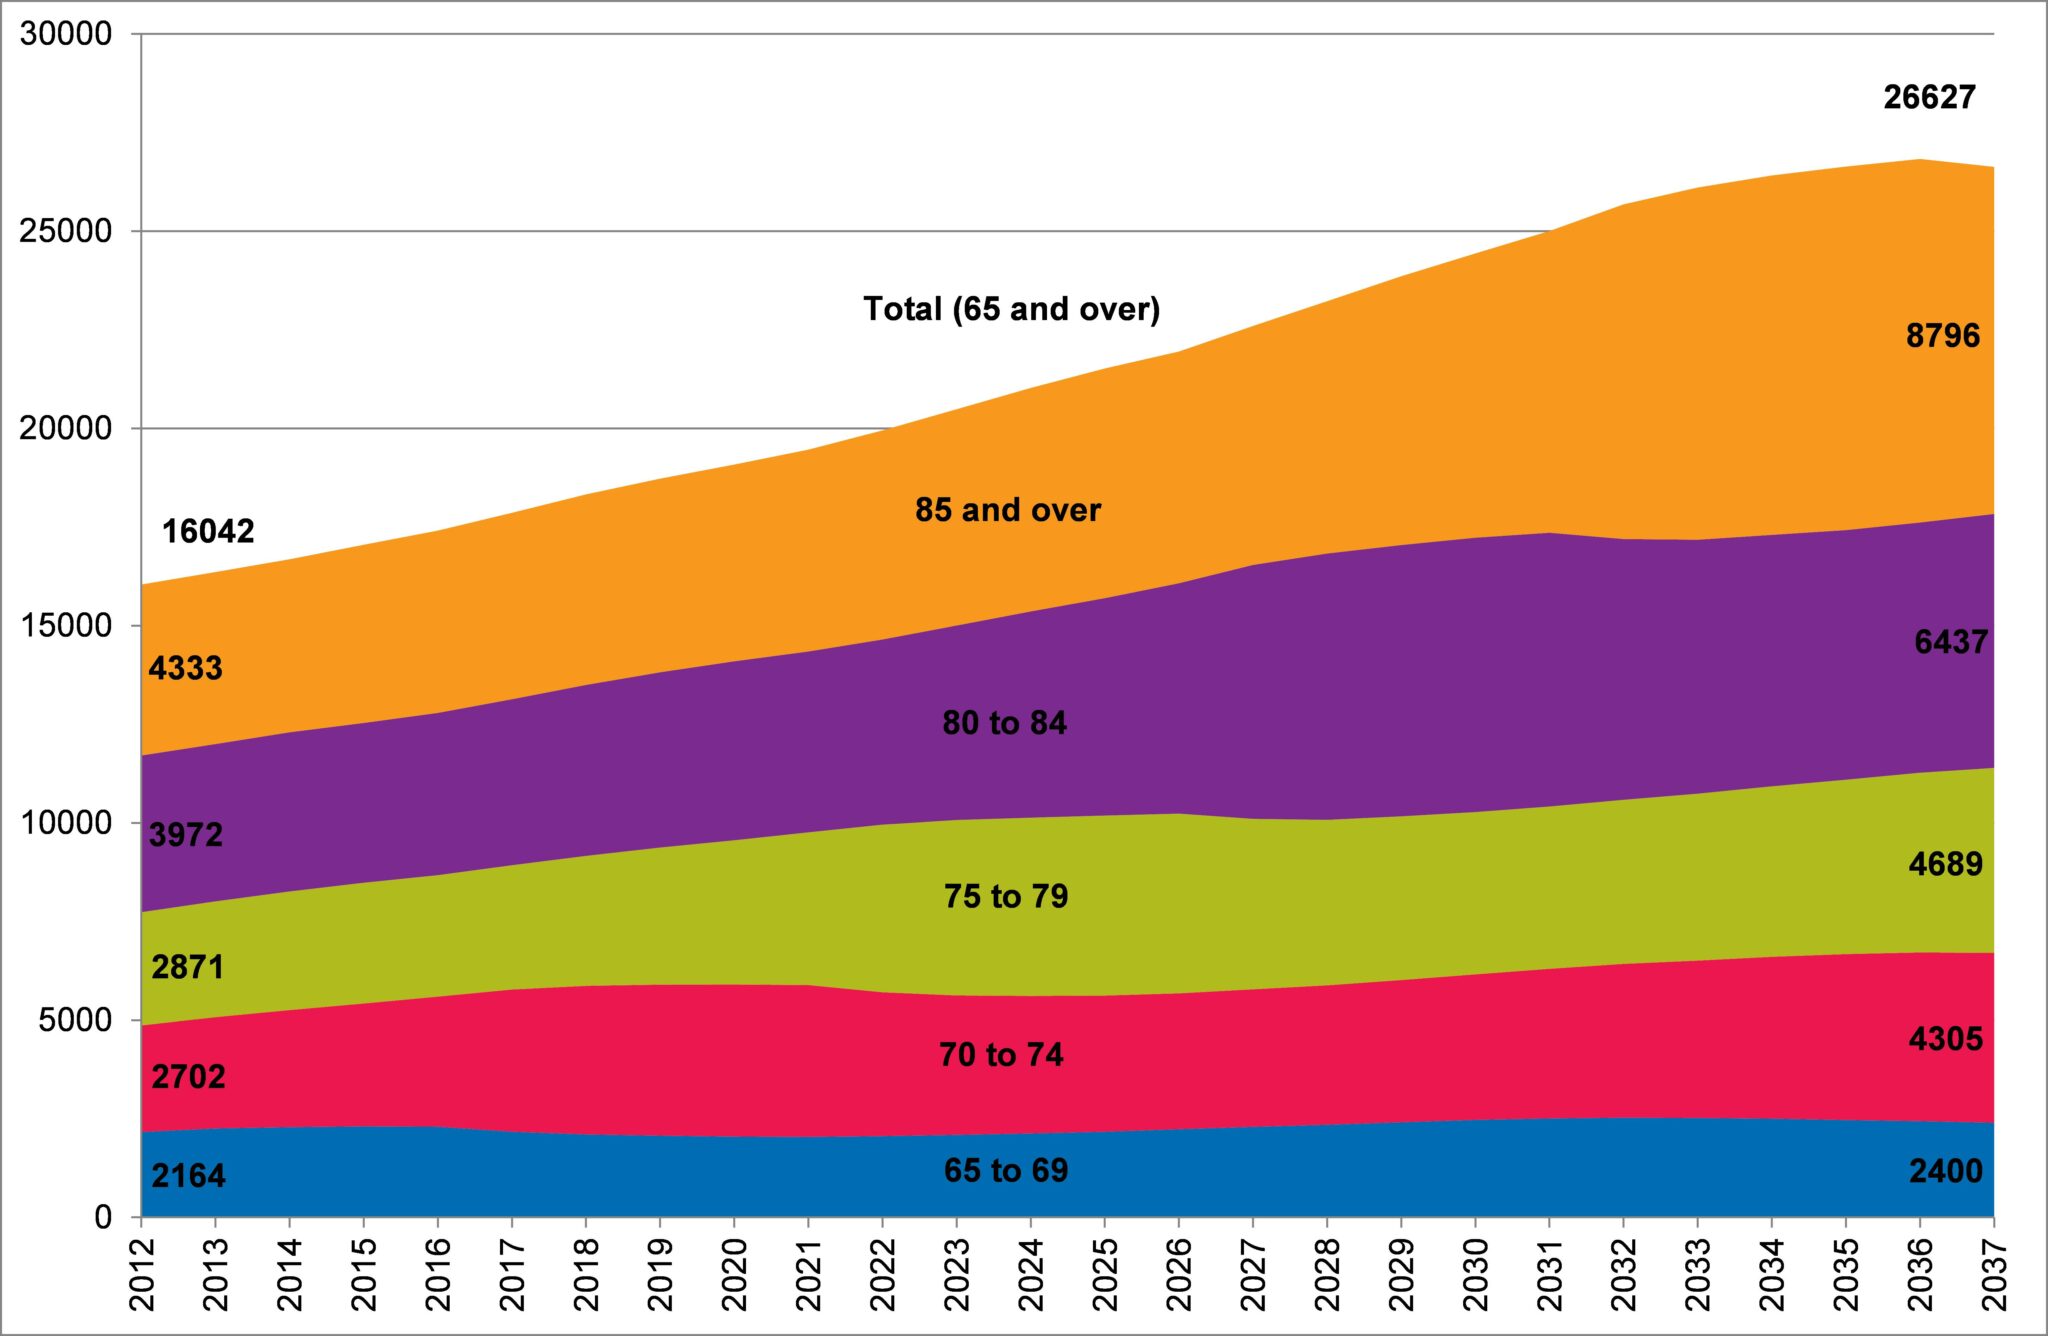
Source: Office for National Statistics 2012 based Sub-National Population Projections, 2014 / Collard et al 2012
As illustrated in figure 10.4, it is predicted that by 2037 there will be 26,627 older people who are frail and 116,272 who are pre-frail.
Figure 10.4, Frailty and Pre-Frailty Projections, Devon, 2012 to 2037
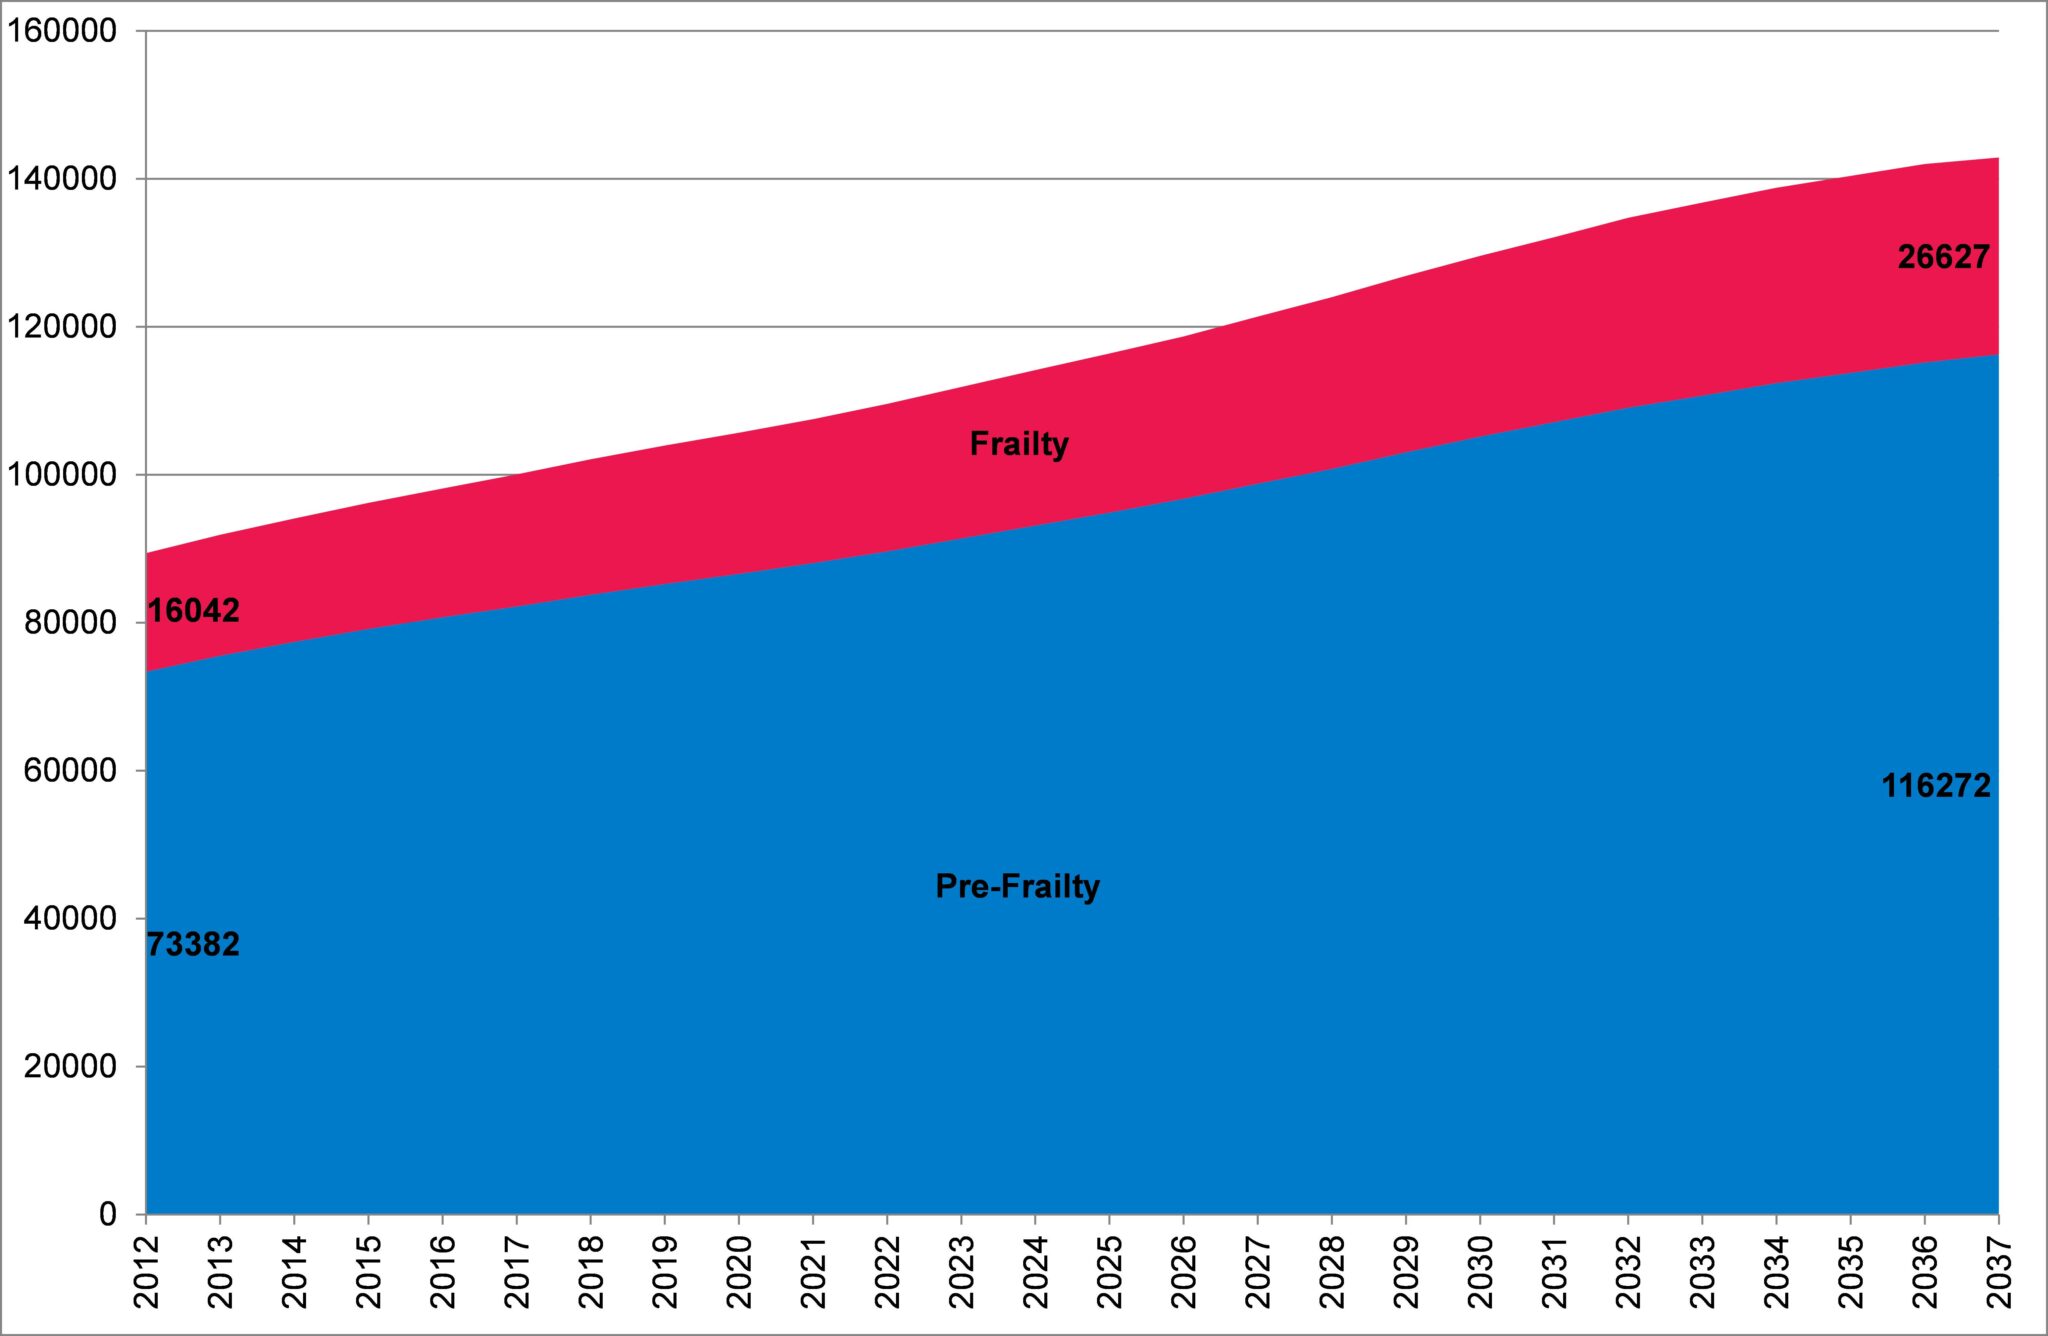
Source: Office for National Statistics 2012 based Sub-National Population Projections, 2014 / Collard et al 2012